AI Generated Quiz
A Level H2 Biology Evolution Diversity Quiz
Free A Level H2 Biology Evolution Diversity quiz, LongCat AI version, with questions, answers, and A Level-style practice for Singapore students.
These static practice materials are generated from the site's syllabus and paper-generation workflow, with source and model context shown so students and parents can evaluate the material before use.
Questions
A-Level Biology H2 Quiz - Evolution Diversity
Name: ___________________________
Class: ___________________________
Date: ___________________________
Score: ________ / 60
Duration: 60 minutes
Total Marks: 60
Instructions:
- Answer ALL questions in the spaces provided.
- The number of marks for each question or part-question is shown in brackets [ ].
- You are advised to spend no more than 60 minutes on this quiz.
- Where a question requires an explanation or description, use precise biological terminology.
- Where diagrams or graphs are referenced, refer to the figure carefully before answering.
Section A: Multiple Choice (Questions 1–5) [10 marks]
Each question is worth 2 marks. Choose the one best answer.
1. Which of the following best describes the role of natural selection in evolution?
A. Natural selection creates new alleles in a population.
B. Natural selection changes allele frequencies in a population over generations.
C. Natural selection ensures that all individuals in a population survive and reproduce equally.
D. Natural selection acts on genotypes directly, regardless of phenotype.
2. A population of beetles shows variation in body colour from light to dark. After a volcanic eruption darkens the environment with ash, the frequency of dark-coloured beetles increases over several generations. Which type of selection best describes this scenario?
A. Stabilising selection
B. Directional selection
C. Disruptive selection
D. Sexual selection
3. Which of the following is a necessary condition for speciation to occur?
A. A single mutation in one individual
B. Reproductive isolation between populations
C. A change in the phenotype of one individual
D. A decrease in population size due to a natural disaster
4. The Hardy-Weinberg equation p2+2pq+q2=1 is used to model allele frequencies in a population. Which of the following conditions is NOT required for Hardy-Weinberg equilibrium to hold?
A. No mutation
B. Random mating
C. Small population size
D. No natural selection
5. Two populations of frogs live on opposite sides of a mountain range. They can no longer interbreed due to geographic separation. Over time, genetic differences accumulate. This is an example of:
A. Sympatric speciation
B. Parapatric speciation
C. Allopatric speciation
D. Peripatric speciation
Section B: Structured Questions (Questions 6–15) [30 marks]
6. (a) Define the term gene pool.
_____________________________________________________________________________ [2]
(b) State two conditions that must be met for a population to be in Hardy-Weinberg equilibrium.
-
- _________________________________________________________________________ [2]
7. In a population of flowers, the allele for red petals (R) is dominant to the allele for white petals (r). In a population of 500 flowers, 320 are red and 180 are white.
(a) Calculate the frequency of the recessive allele (r) in this population. Show your working.
_____________________________________________________________________________ [3]
(b) Using your answer in (a), calculate the expected number of heterozygous red flowers in the population.
_____________________________________________________________________________ [2]
8.
Generated graph for Q8.
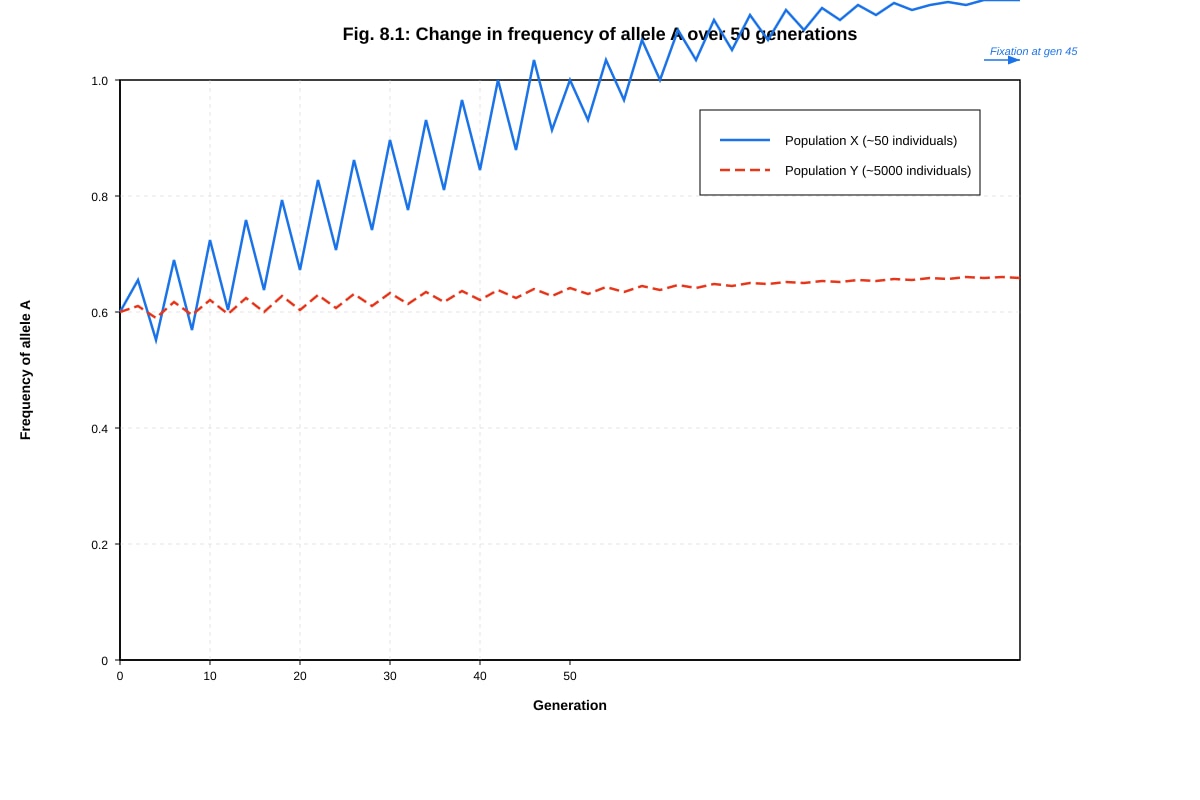
Fig. 8.1 shows the change in frequency of allele A over 50 generations in two populations of different sizes.
(a) With reference to Fig. 8.1, describe the difference in the pattern of change in allele frequency between Population X and Population Y.
_____________________________________________________________________________ [2]
(b) Explain the biological process responsible for the pattern observed in Population X.
_____________________________________________________________________________ [3]
9. Describe three pieces of evidence that support the theory of evolution by natural selection.
_____________________________________________________________________________ [3]
10. Explain how the founder effect can lead to a difference in allele frequencies between a new population and the original population from which it was derived.
_____________________________________________________________________________ [3]
11.
Generated diagram for Q11.
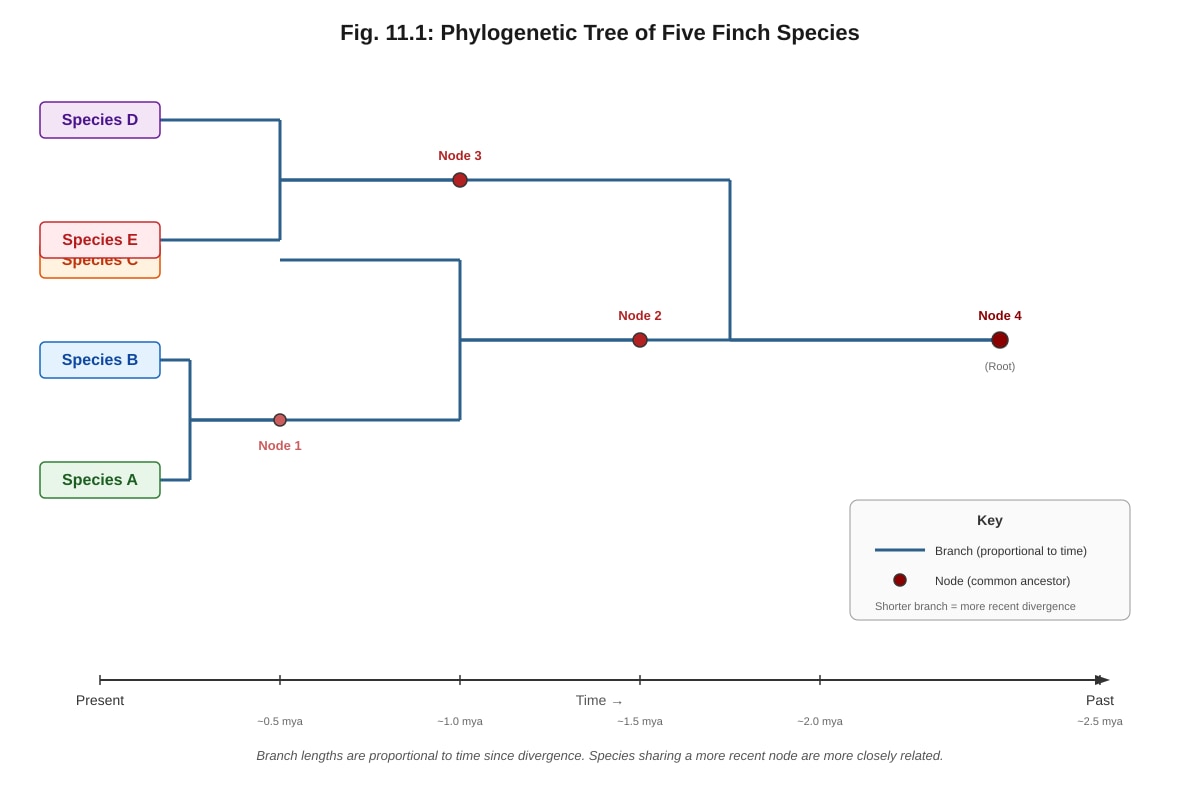
Fig. 11.1 shows a phylogenetic tree for five species of finch.
(a) Identify the pair of species that are most closely related. Explain your reasoning.
_____________________________________________________________________________ [2]
(b) Which species is the outgroup to the clade containing Species A and B? Explain your reasoning.
_____________________________________________________________________________ [2]
12. Distinguish between allopatric speciation and sympatric speciation, giving one example of each.
Allopatric speciation: __________________________________________________________
Example: ____________________________________________________________________
Sympatric speciation: __________________________________________________________
Example: ____________________________________________________________________ [4]
13. Explain how antibiotic resistance in bacteria is an example of evolution by natural selection.
_____________________________________________________________________________ [3]
14. A scientist studying a population of lizards on an island observes that limb length varies considerably. After a severe storm, the vegetation on the island changes, favouring lizards with longer limbs that can climb higher. Over 20 generations, the mean limb length of the population increases.
(a) Name the type of natural selection occurring in this scenario.
_____________________________________________________________________________ [1]
(b) Explain how the allele frequencies for limb length would change in this population over the 20 generations.
_____________________________________________________________________________ [2]
15. Describe the process of adaptive radiation and explain how it contributes to biodiversity.
_____________________________________________________________________________ [3]
Section C: Data-Based and Extended Response Questions (Questions 16–20) [20 marks]
16. Read the following passage and answer the questions that follow.
The Galápagos Islands are home to 15 species of Darwin's finches, all believed to have descended from a single ancestral species that colonised the islands from the South American mainland millions of years ago. These finches show remarkable diversity in beak size and shape, which correlates with their different food sources — some eat seeds, others eat insects, and some even feed on cactus flowers. DNA analysis has revealed that the finch species are monophyletic, meaning they all share a single common ancestor. The ALX1 gene has been identified as a key gene controlling beak shape, while the HMGA2 gene influences beak size.
(a) Explain how the ancestral finch population could have given rise to 15 different species on the Galápagos Islands.
_____________________________________________________________________________ [3]
(b) What does it mean for the finch species to be monophyletic?
_____________________________________________________________________________ [2]
(c) Suggest how natural selection could have acted on the ALX1 and HMGA2 genes to produce the observed diversity in beak morphology.
_____________________________________________________________________________ [3]
17.
Generated graph for Q17.
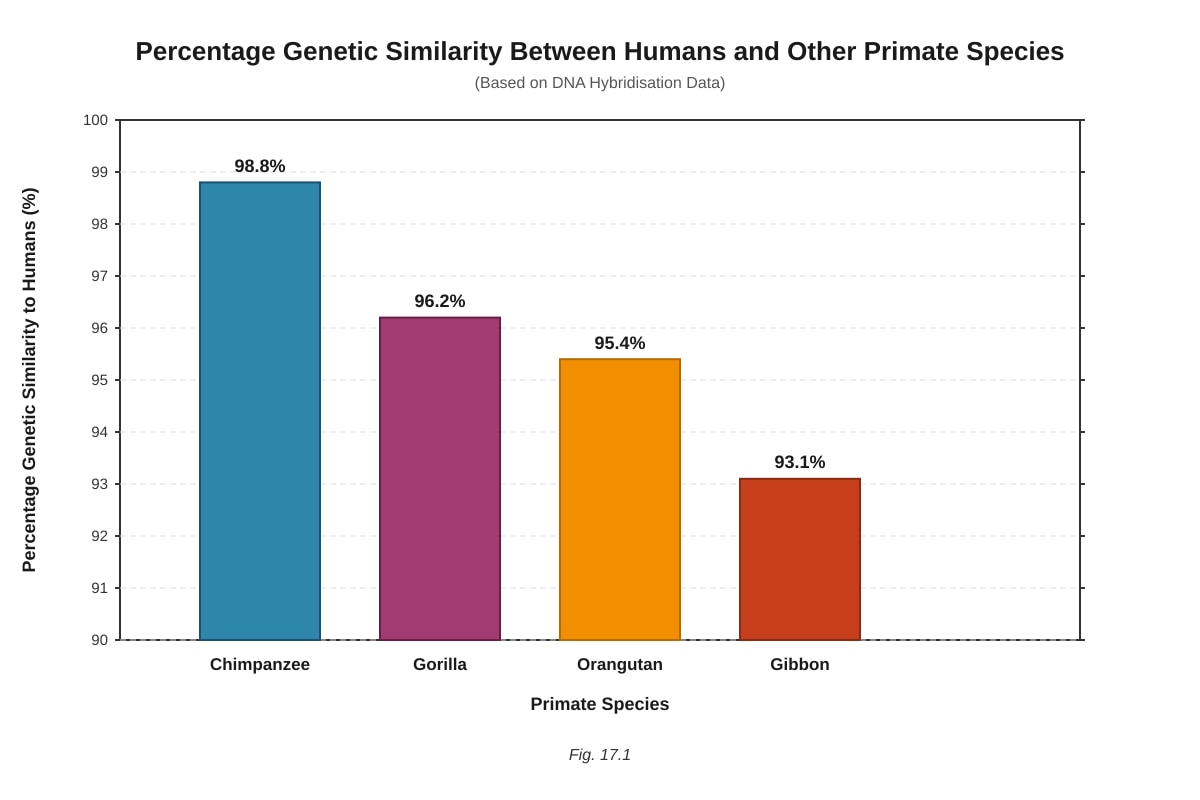
Fig. 17.1 shows the percentage genetic similarity between humans and four other primate species based on DNA hybridisation data.
(a) With reference to Fig. 17.1, which primate species is most closely related to humans? Explain your reasoning.
_____________________________________________________________________________ [2]
(b) Explain how DNA hybridisation can be used to determine the evolutionary relationships between species.
_____________________________________________________________________________ [3]
(c) Suggest one limitation of using DNA hybridisation data alone to construct a phylogenetic tree.
_____________________________________________________________________________ [1]
18. Explain how the following mechanisms can lead to reproductive isolation between populations:
(a) Temporal isolation
_____________________________________________________________________________ [1]
(b) Behavioural isolation
_____________________________________________________________________________ [1]
(c) Hybrid sterility
_____________________________________________________________________________ [1]
(d) Explain why reproductive isolation is essential for speciation.
_____________________________________________________________________________ [2]
19. A population of 2000 mice inhabits a valley. A new allele (a) conferring resistance to a fungal pathogen arises by mutation. The initial frequency of allele a is 0.001. The fungal pathogen is introduced into the valley and kills 90% of non-resistant mice (genotype AA and Aa show no resistance; only aa individuals survive the infection).
(a) Calculate the initial number of mice with genotype aa before the pathogen is introduced. Show your working.
_____________________________________________________________________________ [2]
(b) After the pathogen kills 90% of non-resistant mice, calculate the new frequency of allele a in the surviving population. Show your working.
_____________________________________________________________________________ [4]
(c) Explain whether this scenario represents natural selection or genetic drift. Justify your answer.
_____________________________________________________________________________ [1]
20. Discuss the relative contributions of natural selection and genetic drift to evolution in small populations. In your answer, refer to specific examples and explain how these two processes interact.
_____________________________________________________________________________ [5]
End of Quiz
Answers
A-Level Biology H2 Quiz - Evolution Diversity
Answer Key and Marking Scheme
Section A: Multiple Choice [10 marks]
1. B [2]
Explanation: Natural selection does not create new alleles — mutations do. Natural selection acts on phenotypic variation, favouring individuals with traits that confer higher fitness in a given environment. Over generations, this differential survival and reproduction changes the frequencies of alleles in the population's gene pool. Option C is incorrect because natural selection inherently involves unequal survival and reproduction. Option D is incorrect because natural selection acts on phenotypes, not directly on genotypes (though genotype frequencies change as a consequence).
2. B [2]
Explanation: Directional selection occurs when one extreme of a phenotypic range is favoured, shifting the population mean in that direction. In this case, the darkened environment favours dark-coloured beetles (better camouflage from predators), so the population shifts toward the dark end of the colour spectrum. Stabilising selection (A) favours the intermediate phenotype. Disruptive selection (C) favours both extremes simultaneously. Sexual selection (D) relates to mate choice, not environmental camouflage.
3. B [2]
Explanation: Speciation requires reproductive isolation — the inability of two populations to interbreed and produce fertile offspring. Without gene flow between populations, genetic differences can accumulate through mutation, selection, and drift, eventually leading to the formation of distinct species. A single mutation (A) or phenotypic change in one individual (C) is insufficient on its own. A population bottleneck (D) may accelerate genetic drift but does not guarantee speciation.
4. C [2]
Explanation: Hardy-Weinberg equilibrium requires: (1) no mutation, (2) no natural selection, (3) random mating, (4) no gene flow (migration), and (5) a large population size (to minimise genetic drift). A small population size would violate the condition of no genetic drift, causing allele frequencies to change randomly. Therefore, "small population size" is NOT a condition for Hardy-Weinberg equilibrium — it is the opposite of what is required.
5. C [2]
Explanation: Allopatric speciation occurs when populations are separated by a physical barrier (in this case, a mountain range), preventing gene flow. Over time, the isolated populations accumulate genetic differences through mutation, natural selection, and genetic drift, eventually becoming reproductively isolated. Sympatric speciation (A) occurs without geographic separation. Parapatric speciation (B) occurs in adjacent but overlapping populations. Peripatric speciation (D) is a form of allopatric speciation where a small population becomes isolated at the edge of a larger population's range.
Section B: Structured Questions [30 marks]
6. (a) [2]
The gene pool is the total sum of all the alleles of all the genes present in all the individuals of a population at a given time.
- 1 mark for "total alleles" or "all alleles in a population."
- 1 mark for specifying "all genes" or "all individuals in the population."
- Common mistake: Students sometimes confuse gene pool with genome. A genome refers to all the genetic material of a single organism, while a gene pool refers to all alleles across an entire population.
(b) [2]
Any two of the following (1 mark each):
- No mutation
- No natural selection
- Random mating
- No gene flow (no migration into or out of the population)
- Large population size (no genetic drift)
7. (a) [3]
White flowers are homozygous recessive (rr).
Frequency of rr genotype = q2=500180=0.36
Frequency of recessive allele: q=0.36=0.6
- 1 mark for correctly calculating q2=0.36
- 1 mark for taking the square root: q=0.36
- 1 mark for final answer: q=0.6
- Common mistake: Forgetting to take the square root of q2 to obtain q.
(b) [2]
p=1−q=1−0.6=0.4
Frequency of heterozygous genotype (Rr) = 2pq=2×0.4×0.6=0.48
Expected number of heterozygous red flowers = 0.48×500=240
- 1 mark for calculating 2pq=0.48
- 1 mark for final answer: 240 flowers
- Note: All red flowers include both RR and Rr genotypes. The question asks specifically for heterozygous red flowers (Rr), not all red flowers.
8. (a) [2]
Population X (small population) shows large, random fluctuations in allele frequency over generations, eventually reaching fixation (frequency = 1.0) by generation 45. Population Y (large population) shows minimal fluctuation, with the allele frequency remaining relatively stable near 0.5 throughout all 50 generations.
- 1 mark for describing the large fluctuations / fixation in Population X.
- 1 mark for describing the stability in Population Y.
(b) [3]
The pattern in Population X is caused by genetic drift — random changes in allele frequency due to chance sampling of gametes in each generation. In small populations, genetic drift has a strong effect because chance events can significantly alter allele frequencies from one generation to the next. Over time, genetic drift can lead to the fixation or loss of alleles, as seen when allele A reaches fixation at generation 45.
- 1 mark for identifying genetic drift.
- 1 mark for explaining that drift is stronger in small populations (chance sampling effect).
- 1 mark for linking to fixation/loss of alleles.
- Common mistake: Students may confuse genetic drift with natural selection. Drift is random and non-directional, whereas selection is directional and driven by fitness differences.
9. [3]
Any three of the following (1 mark each):
- Fossil record — shows a chronological sequence of life forms, with simpler organisms in older rock layers and more complex organisms in younger layers, demonstrating gradual change over time.
- Homologous structures — similar anatomical structures in different species (e.g., pentadactyl limb in vertebrates) suggest common ancestry with modification for different functions.
- DNA/molecular evidence — closely related species share a higher percentage of DNA sequence similarity, and molecular clocks can estimate divergence times.
- Biogeography — the geographic distribution of species matches patterns expected from evolution (e.g., endemic species on islands resembling mainland species).
- Direct observation of evolution — examples such as antibiotic resistance in bacteria, pesticide resistance in insects, and industrial melanism in peppered moths demonstrate natural selection occurring in real time.
- Embryological similarities — vertebrate embryos show striking similarities in early developmental stages, suggesting shared ancestry.
- Marking note: Vague answers such as "fossils show evolution" without elaboration receive 0 marks. Each point must be a specific type of evidence with a brief explanation.
10. [3]
The founder effect occurs when a small number of individuals become isolated from a larger population and establish a new colony. The small group of founders carries only a sample of the alleles present in the original population's gene pool. By chance, some alleles may be overrepresented, underrepresented, or entirely absent in the founding group. As the new population grows from these few founders, the allele frequencies will reflect those of the founding individuals rather than the original population. This can lead to significant differences in allele frequencies between the new and original populations.
- 1 mark for defining the founder effect (small group establishes new population).
- 1 mark for explaining that founders carry only a subset/sample of alleles.
- 1 mark for explaining that allele frequencies in the new population differ from the original due to chance sampling.
- Common mistake: Students may confuse the founder effect with a population bottleneck. The founder effect involves colonisation by a small group, while a bottleneck involves a drastic reduction in population size due to an event.
11. (a) [2]
Species A and B are most closely related. They share the most recent common ancestor at Node 1, which is the youngest (most recent) node on the phylogenetic tree. The branch length between their divergence point and the present is the shortest, indicating the least amount of evolutionary time since they diverged.
- 1 mark for identifying Species A and B.
- 1 mark for explaining that they share the most recent common ancestor (Node 1).
(b) [2]
Species C, D, and E are all outside the clade containing Species A and B. However, Species C is the closest outgroup to the A-B clade because it shares Node 2 as a common ancestor with A and B, whereas D and E diverged earlier at Node 4. If the question asks for a single outgroup to the A-B clade specifically, Species C is the most appropriate answer as it is the sister group to the A-B clade.
- 1 mark for identifying Species C (or D/E as outside the clade, with reasoning).
- 1 mark for explaining the reasoning based on the branching pattern / most recent common ancestor.
- Marking note: Accept any of C, D, or E as an outgroup with valid reasoning. Award full marks if the student correctly identifies that C is the sister group to the A-B clade.
12. [4]
Allopatric speciation occurs when populations are geographically separated by a physical barrier (e.g., mountain range, ocean, river), preventing gene flow. Genetic differences accumulate through mutation, natural selection, and genetic drift in the isolated populations, eventually leading to reproductive isolation.
Example: The formation of new species of finches on different Galápagos Islands, separated by ocean.
Sympatric speciation occurs within a single geographic area without physical separation. Reproductive isolation arises through mechanisms such as polyploidy (in plants), habitat differentiation, or sexual selection.
Example: The apple maggot fly (Rhagoletis pomonella) diverged from the hawthorn-feeding population after some individuals began feeding on apples introduced to North America — speciation occurred without geographic isolation.
- 1 mark for correct definition of allopatric speciation.
- 1 mark for correct example of allopatric speciation.
- 1 mark for correct definition of sympatric speciation.
- 1 mark for correct example of sympatric speciation.
- Common mistake: Students may confuse the two or provide vague examples without specifying the mechanism of isolation.
13. [3]
Within a bacterial population, genetic variation exists due to random mutations. Some bacteria may carry a mutation that confers resistance to a particular antibiotic. When the population is exposed to the antibiotic, non-resistant bacteria are killed, while resistant bacteria survive and reproduce. The resistant bacteria pass the resistance allele to their offspring. Over successive generations, the frequency of the resistance allele increases in the population. This is evolution by natural selection — the environment (antibiotic) acts as the selective pressure, favouring individuals with the resistance trait.
- 1 mark for mentioning pre-existing genetic variation/mutation.
- 1 mark for explaining differential survival (antibiotic kills non-resistant, resistant survive).
- 1 mark for explaining increase in resistance allele frequency over generations (evolution).
- Common mistake: Students may incorrectly state that the antibiotic causes the resistance mutation. The mutation arises randomly; the antibiotic selects for pre-existing resistant individuals.
14. (a) [1]
Directional selection.
(b) [2]
The alleles conferring longer limbs would increase in frequency over the 20 generations, because lizards with longer limbs have higher fitness (can access food sources at higher vegetation) and are more likely to survive and reproduce. Conversely, alleles for shorter limbs would decrease in frequency as these lizards are less likely to survive and reproduce in the changed environment. The population's mean limb length shifts toward the longer-limb extreme.
- 1 mark for stating that alleles for longer limbs increase in frequency.
- 1 mark for explaining the mechanism (higher fitness → more reproduction → allele frequency change).
15. [3]
Adaptive radiation is the rapid evolutionary divergence of a single ancestral species into multiple new species, each adapted to exploit different ecological niches. It typically occurs when a population colonises a new environment with diverse, unoccupied niches (e.g., islands, lakes) or after a mass extinction event opens up ecological opportunities. Natural selection drives populations to adapt to different resources or habitats, leading to divergent evolution and eventually reproductive isolation. Adaptive radiation contributes to biodiversity by producing many new species from a single ancestor, each filling a different ecological role.
- 1 mark for defining adaptive radiation (one ancestor → many species, different niches).
- 1 mark for explaining the mechanism (natural selection in different niches/environments).
- 1 mark for linking to biodiversity (increased species diversity).
- Example: Darwin's finches on the Galápagos Islands — one ancestral species diversified into ~15 species with different beak shapes adapted to different food sources.
Section C: Data-Based and Extended Response Questions [20 marks]
16. (a) [3]
The ancestral finch population colonised different islands in the Galápagos archipelago. Geographic separation between islands led to reproductive isolation (allopatric speciation). On each island, different food sources created different selective pressures. Natural selection favoured finches with beak shapes best suited to the available food on each island. Over many generations, genetic differences accumulated between island populations. Eventually, the populations became so genetically distinct that they could no longer interbreed — they had become separate species. This process repeated across multiple islands, producing 15 species.
- 1 mark for geographic isolation / allopatric speciation.
- 1 mark for natural selection acting on beak morphology in response to different food sources.
- 1 mark for accumulation of genetic differences leading to reproductive isolation.
(b) [2]
Monophyletic means that all 15 finch species share a single common ancestor and include all the descendants of that ancestor. In other words, the group (clade) consists of the common ancestor and every species that evolved from it, with no species excluded.
- 1 mark for "share a single common ancestor."
- 1 mark for "includes all descendants of that ancestor" or equivalent.
(c) [3]
Different food sources on different islands exerted different selective pressures on beak shape and size. On islands where large, hard seeds were abundant, finches with larger, stronger beaks (influenced by HMGA2) had higher fitness and were selected for. On islands where insects were the main food source, finches with pointed, narrow beaks (influenced by ALX1) were favoured. Over generations, natural selection increased the frequency of alleles at the ALX1 and HMGA2 loci that produced beak morphologies best suited to the local food source. This divergent selection on these genes contributed to the morphological diversity observed among the 15 species.
- 1 mark for linking different food sources to different selective pressures.
- 1 mark for explaining how ALX1 and HMGA2 alleles were selected for/against depending on the environment.
- 1 mark for explaining that this led to divergent evolution and species diversification.
17. (a) [2]
The chimpanzee is most closely related to humans, with 98.8% genetic similarity. The higher the percentage of DNA sequence similarity, the more recently two species shared a common ancestor. Since chimpanzees show the highest percentage similarity to humans among the four species, they diverged from the human lineage most recently.
- 1 mark for identifying chimpanzee.
- 1 mark for explaining that higher genetic similarity indicates more recent common ancestry.
(b) [3]
DNA hybridisation involves extracting DNA from two species, heating it to separate the strands, and then mixing the single strands from both species. Where the sequences are complementary, the strands from the two species will hybridise (bind together). The more similar the DNA sequences, the more hydrogen bonds form between the hybridised strands, and the more heat is required to separate them (higher melting temperature). By measuring the melting temperature or percentage of hybridisation, scientists can estimate the degree of genetic similarity between species, which reflects how closely related they are evolutionarily.
- 1 mark for describing the process (strand separation, mixing, hybridisation).
- 1 mark for explaining that more similar sequences = stronger binding.
- 1 mark for linking genetic similarity to evolutionary relatedness.
(c) [1]
Any one of the following:
- DNA hybridisation gives an overall similarity measure but does not identify which specific genes or sequences differ, so it cannot pinpoint the exact genetic changes responsible for divergence.
- It cannot distinguish between homologous sequences and sequences that are similar by chance (convergent evolution at the molecular level).
- It does not provide information about the timing of divergence events (unlike molecular clocks based on specific gene sequences).
- It compares total DNA, which includes non-coding regions that may evolve at different rates, potentially giving misleading similarity values.
18. (a) [1]
Temporal isolation: Populations reproduce at different times (e.g., different seasons, different times of day), preventing interbreeding. Example: One species of orchid releases pollen in the morning, while a closely related species releases pollen in the evening.
(b) [1]
Behavioural isolation: Populations have different courtship rituals, mating calls, or other behaviours that prevent them from recognising each other as potential mates. Example: Different species of fireflies have distinct flash patterns to attract mates of their own species.
(c) [1]
Hybrid sterility: When two species do interbreed, the hybrid offspring are produced but are sterile and cannot reproduce. This prevents gene flow between the species. Example: A mule (hybrid of a horse and a donkey) is sterile.
(d) [2]
Reproductive isolation is essential for speciation because it prevents gene flow between populations. Without gene flow, genetic differences can accumulate through mutation, natural selection, and genetic drift. Over time, these accumulated differences become so great that the populations can no longer interbreed even if they come into contact again — they have become separate species. If reproductive isolation did not exist, gene flow would homogenise the populations, preventing divergence.
- 1 mark for explaining that reproductive isolation prevents gene flow.
- 1 mark for explaining that without gene flow, genetic differences accumulate, leading to speciation.
19. (a) [2]
Frequency of allele a = q=0.001
Frequency of genotype aa = q2=(0.001)2=0.000001
Number of aa mice = 0.000001×2000=0.002
Since this is much less than 1, in practice there may be 0 or 1 individual with genotype aa in the population. For the calculation:
Expected number of aa = q2×N=(0.001)2×2000=0.002 individuals.
- 1 mark for calculating q2=0.000001.
- 1 mark for multiplying by population size to get 0.002 (or stating approximately 0 individuals).
- Note: This very low number illustrates that a rare recessive allele is almost entirely "hidden" in heterozygous carriers.
(b) [4]
Step 1: Calculate initial genotype frequencies (assuming Hardy-Weinberg):
p=1−0.001=0.999
Frequency of AA = p2=(0.999)2=0.998001
Frequency of Aa = 2pq=2×0.999×0.001=0.001998
Frequency of aa = q2=0.000001
Step 2: Calculate initial numbers:
Number of AA = 0.998001×2000=1996
Number of Aa = 0.001998×2000=3.996≈4
Number of aa = 0.000001×2000=0.002≈0
Step 3: After the pathogen kills 90% of non-resistant mice (AA and Aa):
Surviving AA = 1996×0.10=199.6≈200
Surviving Aa = 4×0.10=0.4≈0
Surviving aa = 0 (since there were essentially 0 to begin with)
Revised calculation (assuming at least 1 aa individual exists):
If we assume 1 aa individual exists initially:
Surviving aa = 1 (fully resistant)
Surviving AA = 1996×0.1=199.6
Surviving Aa = 4×0.1=0.4
Total survivors ≈ 199.6+0.4+1=201
New frequency of allele a:
From Aa survivors: 0.4 copies of a
From aa survivors: 2 copies of a
Total a alleles = 0.4+2=2.4
Total alleles in survivors = 2×201=402
New frequency of a = 4022.4≈0.006
- 1 mark for calculating initial genotype frequencies.
- 1 mark for calculating numbers of each genotype.
- 1 mark for applying the 90% mortality correctly.
- 1 mark for calculating the new allele frequency (accept answers in the range 0.005–0.01 depending on rounding assumptions).
- Note: The key concept is that the frequency of allele a increases dramatically because only aa individuals survive, even though the absolute number is small.
(c) [1]
This scenario represents natural selection because the change in allele frequency is driven by differential survival based on genotype. The fungal pathogen acts as a selective pressure, favouring individuals with the resistance genotype (aa) over non-resistant individuals (AA and Aa). The change is directional and non-random, which is characteristic of natural selection rather than genetic drift.
20. [5]
Natural selection is a non-random process in which individuals with traits that confer higher fitness in a given environment are more likely to survive and reproduce. Over generations, this leads to an increase in the frequency of advantageous alleles. In small populations, natural selection still operates, but its effectiveness can be reduced because genetic drift can override selective pressures.
Genetic drift is a random process in which allele frequencies change due to chance sampling of gametes. In small populations, genetic drift has a much stronger effect because chance events can cause large fluctuations in allele frequency from one generation to the next. Drift can lead to the fixation or loss of alleles regardless of whether they are beneficial, neutral, or slightly deleterious.
Interaction in small populations: In small populations, genetic drift can overpower natural selection. For example, a beneficial allele may be lost by chance before selection can increase its frequency, or a slightly deleterious allele may become fixed through drift. This is particularly relevant in conservation biology — endangered species with small populations may lose genetic variation through drift, reducing their ability to adapt to changing environments.
Example: The founder effect (a form of genetic drift) occurs when a small group establishes a new population. The allele frequencies in the new population may differ significantly from the original population by chance alone. Subsequent natural selection then acts on this altered gene pool, but the initial composition was determined by drift.
In summary, both processes contribute to evolution, but in small populations, genetic drift tends to dominate, potentially reducing the efficiency of natural selection and leading to random changes in allele frequencies that may not be adaptive.
- 1 mark for explaining natural selection clearly.
- 1 mark for explaining genetic drift clearly.
- 1 mark for explaining why drift is stronger in small populations.
- 1 mark for explaining how drift and selection interact in small populations.
- 1 mark for providing a relevant example and linking to evolutionary consequences.
- Marking descriptors:
- 5 marks: Comprehensive explanation of both processes, clear interaction described, relevant example provided, well-structured answer.
- 3–4 marks: Both processes explained but interaction or example lacking in depth.
- 1–2 marks: Only one process explained, or both mentioned but poorly explained.
- 0 marks: No relevant content.
Total: 60 marks
Free quiz and exam paper access
Enter your details to view this paper
Your access is remembered on this device.