AI Generated Quiz
A Level H2 Biology Ecology Quiz
Free A Level H2 Biology Ecology quiz, LongCat AI version, with questions, answers, and A Level-style practice for Singapore students.
These static practice materials are generated from the site's syllabus and paper-generation workflow, with source and model context shown so students and parents can evaluate the material before use.
Questions
A-Level Biology H2 Quiz - Ecology
Name: ______________________________
Class: ______________________________
Date: ______________________________
Score: ________ / 60
Duration: 75 minutes
Total Marks: 60
Instructions:
- Answer all questions in the spaces provided.
- The number of marks for each question is shown in brackets [ ].
- You may use a calculator where appropriate.
- Write your answers in dark blue or black pen.
- Quality of written communication will be assessed in questions marked with an asterisk (*).
Section A: Energy Flow and Ecosystem Dynamics (Questions 1–7)
1. Define the term trophic level and give one example of an organism from each of the first three trophic levels in a named ecosystem. [4]
2. Distinguish between gross primary productivity (GPP) and net primary productivity (NPP). Explain why NPP is always less than GPP. [4]
3. Fig. 3.1 shows a simplified food web in a temperate forest ecosystem.
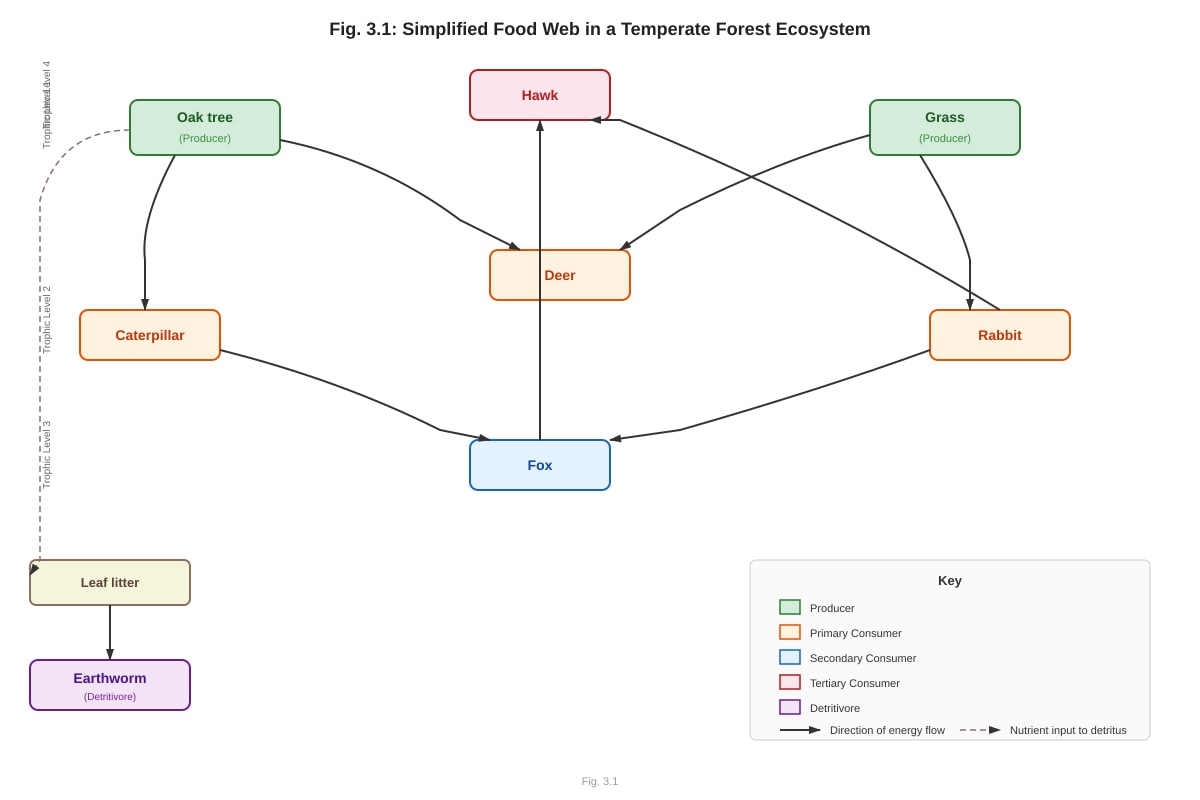
Generated diagram for Q3.
(a) Identify the organism in Fig. 3.1 that occupies more than one trophic level. Explain your answer. [2]
(b) Explain what would happen to the population of foxes if the hawk population decreased significantly. Assume no other changes to the ecosystem. [3]
(c) Explain the role of the earthworm in energy flow through this ecosystem. [2]
4. A student measured the energy content at different trophic levels in a freshwater lake ecosystem. The results are shown in Table 4.1.
| Trophic Level | Organism | Energy available / kJ m⁻² yr⁻¹ |
|---|---|---|
| Producers | Phytoplankton | 8 500 |
| Primary consumers | Zooplankton | 1 020 |
| Secondary consumers | Small fish | 122 |
| Tertiary consumers | Large fish | 11 |
(a) Calculate the percentage energy transfer efficiency from producers to primary consumers. Show your working. [2]
(b) Calculate the percentage energy transfer efficiency from secondary consumers to tertiary consumers. Show your working. [2]
(c) Explain why the energy transfer between trophic levels is typically only about 10% efficient. Include at least three distinct reasons. [3]
5. Explain why food chains rarely exceed four or five trophic levels. Your answer should refer to energy transfer efficiency and the implications for biomass at higher trophic levels. [3]
6. Describe how pyramids of biomass differ from pyramids of numbers, and explain why pyramids of biomass are generally more useful in ecological studies. Include one example where a pyramid of numbers could be inverted. [4]
7.* Explain how energy enters an ecosystem, flows through it, and is eventually lost. In your answer, refer to the roles of producers, consumers, and decomposers, and explain why energy flow is described as a one-way process rather than a cycle. [6]
Section B: Nutrient Cycling (Questions 8–13)
8. Outline the role of nitrifying bacteria in the nitrogen cycle. Name the two groups of nitrifying bacteria involved and describe the chemical transformation each carries out. [4]
9. Explain the significance of nitrogen fixation in ecosystems. Include reference to at least one free-living nitrogen-fixing bacterium and one example of a symbiotic relationship involving nitrogen fixation. [4]
10. Fig. 10.1 shows a simplified carbon cycle.
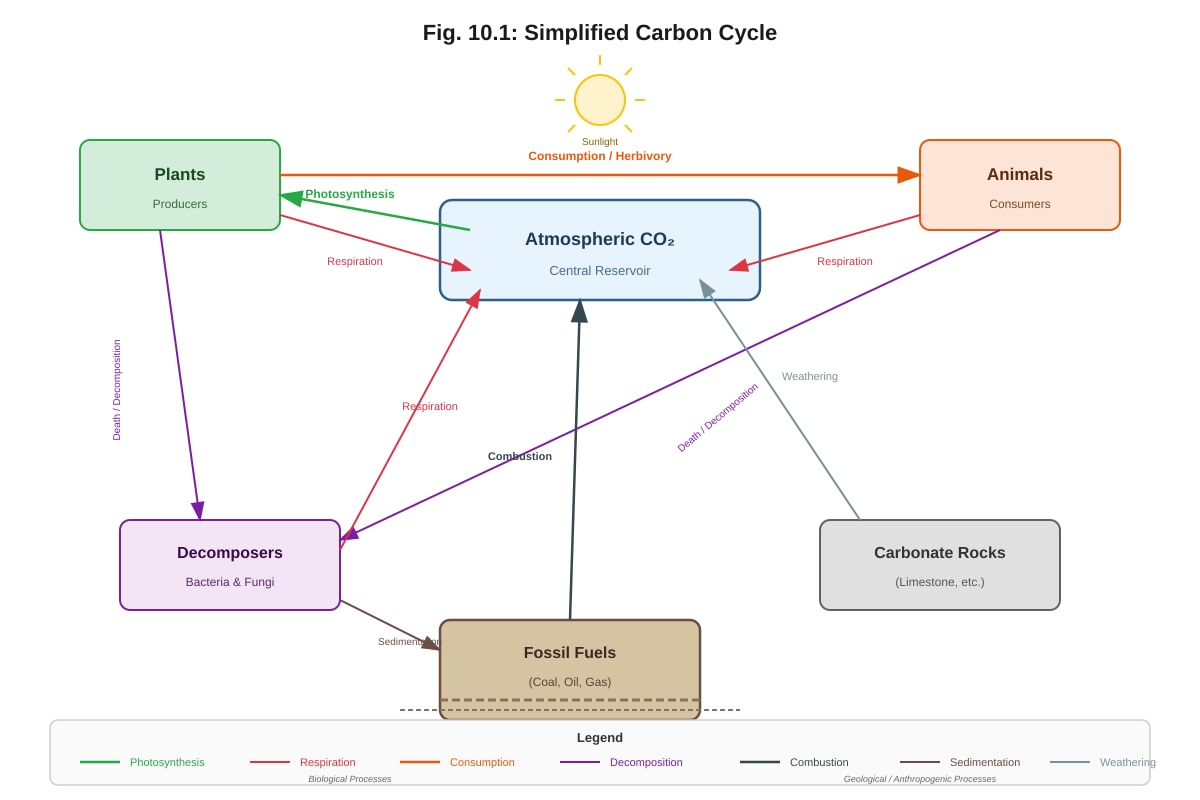
Generated diagram for Q10.
(a) With reference to Fig. 10.1, identify two processes that remove carbon dioxide from the atmosphere. [2]
(b) Explain how human activities have disrupted the carbon cycle. Refer to at least two specific human activities and their consequences. [3]
(c) Explain why the carbon cycle is described as a biogeochemical cycle. [2]
11. Describe the process of decomposition and explain its importance in nutrient cycling. Include reference to the roles of saprotrophic organisms and detritivores. [4]
12. Explain how the combustion of fossil fuels contributes to the enhanced greenhouse effect. In your answer, explain the mechanism by which increased atmospheric carbon dioxide concentration leads to global warming. [4]
13. A farmer clears a tropical rainforest to create agricultural land. Explain how this deforestation affects both the carbon cycle and the nitrogen cycle in the local ecosystem. [5]
Section C: Populations, Biodiversity, and Environmental Issues (Questions 14–20)
14. Define the term carrying capacity (K) and explain three factors that can determine the carrying capacity of an environment for a named species. [4]
15. Fig. 15.1 shows a population growth curve for a species of bacteria grown in a closed culture.
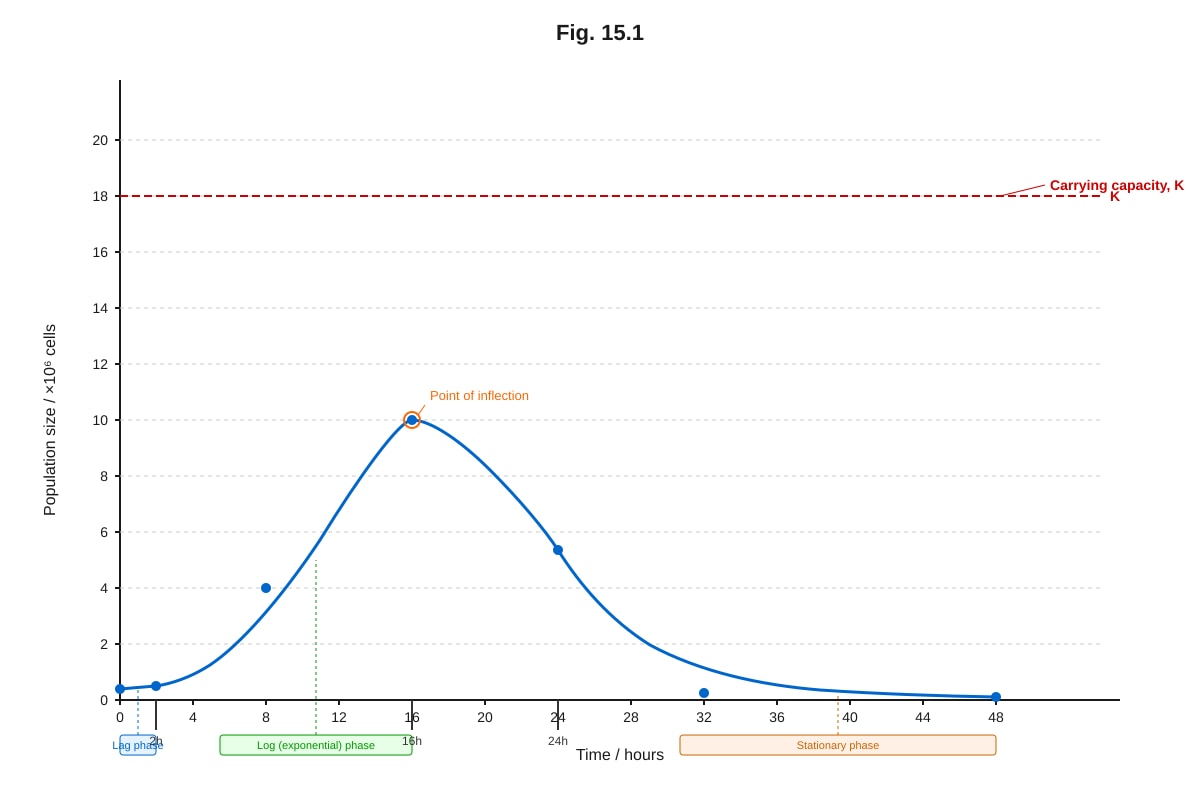
Generated graph for Q15.
(a) With reference to Fig. 15.1, state the approximate carrying capacity for this bacterial population. [1]
(b) Explain the shape of the curve during the log (exponential) phase. [2]
(c) Explain why the population size levels off during the stationary phase. [3]
16. Explain the difference between interspecific and intraspecific competition. For each type, describe how it can affect population size and give one example. [4]
17. Describe how predator-prey relationships can lead to population oscillations. Use a named example to illustrate your answer, and explain why predator population changes typically lag behind prey population changes. [5]
18. Explain what is meant by biodiversity. Describe three levels of biodiversity and explain why maintaining high biodiversity is important for ecosystem stability. [5]
19. A conservation biologist is studying the impact of an invasive species on a native ecosystem. The invasive grey squirrel (Sciurus carisatensis) was introduced to a woodland ecosystem where the native red squirrel (Sciurus vulgaris) was the only squirrel species.
(a) Suggest two ways in which the grey squirrel might outcompete the red squirrel. [2]
(b) Explain how the introduction of the grey squirrel could affect other species in the food web, beyond the red squirrel. [3]
(c) Suggest one conservation strategy that could be used to protect the red squirrel population, and explain how it would work. [2]
20.* Discuss the ecological consequences of eutrophication in freshwater ecosystems. In your answer, describe the sequence of events that occurs, explain the biological and chemical changes at each stage, and evaluate one strategy for managing or preventing eutrophication. [6]
Answers
A-Level Biology H2 Quiz - Ecology: Answer Key
Section A: Energy Flow and Ecosystem Dynamics
Question 1 [4 marks]
Answer: A trophic level is the position an organism occupies in a food chain, defined by its feeding relationship to other organisms.
- Trophic level 1 (Producers): e.g., grass in a grassland ecosystem — autotrophs that convert light energy into chemical energy via photosynthesis.
- Trophic level 2 (Primary consumers): e.g., rabbit in a grassland ecosystem — herbivores that feed directly on producers.
- Trophic level 3 (Secondary consumers): e.g., fox in a grassland ecosystem — carnivores that feed on primary consumers.
Marking scheme: 1 mark for correct definition of trophic level. 1 mark each for a correct organism at each of the first three trophic levels (organism must be consistent with the named ecosystem).
Common mistakes: Students may confuse trophic levels with the organism itself (e.g., saying "producer" is a trophic level rather than identifying an organism). The definition must reference position in a food chain or feeding relationship.
Question 2 [4 marks]
Answer:
- Gross Primary Productivity (GPP) is the total amount of chemical energy fixed by photosynthesis per unit area per unit time in a producer population. It represents the total light energy converted to chemical energy.
- Net Primary Productivity (NPP) is the amount of chemical energy remaining in producers after subtracting the energy used by the producers themselves for respiration. It represents the energy available to primary consumers.
NPP is always less than GPP because producers use a significant proportion of the energy they fix through photosynthesis for their own cellular respiration. This respiratory loss means not all fixed energy is available as biomass for the next trophic level.
The relationship is: NPP = GPP − R (where R = energy lost through producer respiration).
Marking scheme: 1 mark for correct definition of GPP. 1 mark for correct definition of NPP. 1 mark for stating that NPP < GPP because of respiratory losses. 1 mark for explaining that respiration uses some of the energy fixed by photosynthesis (or stating the equation NPP = GPP − R).
Common mistakes: Students often confuse GPP and NPP or fail to mention respiration as the reason for the difference. Some may incorrectly state that NPP is greater than GPP.
Question 3 [7 marks total]
(a) [2 marks]
Answer: The fox occupies more than one trophic level. The fox feeds on caterpillars (which are primary consumers, feeding on the oak tree), making the fox a secondary consumer in that food chain. The fox also feeds on rabbits (which are primary consumers, feeding on grass), also making it a secondary consumer. However, the hawk also occupies more than one trophic level: it feeds on rabbits (primary consumers → hawk is secondary consumer) and on foxes (secondary consumers → hawk is tertiary consumer). Therefore, the hawk is the organism that occupies more than one trophic level, as it functions as both a secondary and tertiary consumer depending on its food source.
Marking scheme: 1 mark for identifying the hawk. 1 mark for explaining that it feeds on both primary consumers (rabbits) and secondary consumers (foxes), occupying both secondary and tertiary consumer levels.
Common mistakes: Students may identify the fox, which only feeds on primary consumers (caterpillars and rabbits), so it occupies only one trophic level (secondary consumer). The hawk is the correct answer because it feeds at two different trophic levels.
(b) [3 marks]
Answer: If the hawk population decreased significantly, the fox population would initially increase. This is because hawks are predators of foxes, so a reduction in hawk numbers would reduce predation pressure on the fox population. With fewer foxes being consumed, more foxes would survive and reproduce, leading to population growth. However, over time, the increased fox population would exert greater predation pressure on rabbits and caterpillars, potentially reducing their populations. This could eventually lead to food limitation for foxes, causing the fox population to stabilise or decline.
Marking scheme: 1 mark for stating that the fox population would increase. 1 mark for explaining reduced predation pressure from hawks. 1 mark for explaining the subsequent effect on prey populations or eventual stabilisation.
(c) [2 marks]
Answer: The earthworm acts as a detritivore (or decomposer). It feeds on dead organic matter (leaf litter from the oak tree), breaking it down into smaller particles. This increases the surface area available for saprotrophic decomposers (bacteria and fungi) to act upon, accelerating the decomposition process. Through this role, the earthworm facilitates the recycling of nutrients (such as nitrogen, phosphorus, and carbon) locked in dead organic matter back into the soil, making them available for uptake by producers (plants).
Marking scheme: 1 mark for identifying the earthworm as a detritivore/decomposer that feeds on dead organic matter. 1 mark for explaining its role in nutrient recycling or increasing surface area for decomposition.
Question 4 [7 marks total]
(a) [2 marks]
Answer: Percentage energy transfer efficiency from producers to primary consumers:
Efficiency=Energy at producersEnergy at primary consumers×100=85001020×100=12.0%
Marking scheme: 1 mark for correct formula/working. 1 mark for correct answer (12.0% or 12%).
(b) [2 marks]
Answer: Percentage energy transfer efficiency from secondary consumers to tertiary consumers:
Efficiency=Energy at secondary consumersEnergy at tertiary consumers×100=12211×100=9.0%
Marking scheme: 1 mark for correct formula/working. 1 mark for correct answer (9.0% or 9%).
(c) [3 marks]
Answer: Energy transfer between trophic levels is typically only about 10% efficient because:
-
Respiratory losses: Organisms at each trophic level use a large proportion of the energy they assimilate for cellular respiration to fuel metabolic processes (movement, homeostasis, growth). This energy is lost as heat and cannot be passed to the next trophic level.
-
Incomplete consumption: Not all organisms at one trophic level are consumed by organisms at the next trophic level. Some die and are decomposed without being eaten.
-
Incomplete digestion and assimilation: Not all material consumed is digested and assimilated. Some energy is lost in faeces (egestion) as it was not absorbed by the consumer.
Marking scheme: 1 mark for each valid reason, up to 3 marks. Acceptable reasons include: respiratory losses (energy lost as heat), incomplete consumption (not all organisms eaten), incomplete digestion/assimilation (energy lost in faeces), energy lost in urine/excretion.
Common mistakes: Students may only give one or two reasons, or may incorrectly state that energy is "destroyed" (violating the law of conservation of energy). Energy is not destroyed — it is converted to heat that cannot be reused by organisms.
Question 5 [3 marks]
Answer: Food chains rarely exceed four or five trophic levels because energy transfer between trophic levels is inefficient (typically ~10%). At each trophic level, approximately 90% of the available energy is lost, primarily through respiration (as heat), incomplete consumption, and egestion. By the fourth or fifth trophic level, the remaining energy is insufficient to support a viable population of organisms. For example, if producers capture 100 000 kJ of energy, only about 10 kJ would be available at the fourth trophic level (100 000 → 10 000 → 1 000 → 100 → 10), which is too little to sustain a population. This limits the biomass that can be supported at higher trophic levels.
Marking scheme: 1 mark for stating that energy transfer is ~10% efficient. 1 mark for explaining that insufficient energy remains after 4–5 levels. 1 mark for explaining the consequence (insufficient biomass/energy to support a viable population).
Question 6 [4 marks]
Answer: A pyramid of biomass shows the total mass of living material (biomass) at each trophic level per unit area, typically measured in g m⁻² or kg m⁻². A pyramid of numbers shows the number of individual organisms at each trophic level.
Pyramids of biomass are generally more useful because they account for the size of organisms. A pyramid of numbers can be inverted when a single large organism (e.g., one oak tree) supports many smaller consumers (e.g., thousands of insects). In this case, the pyramid of numbers would be inverted (more individuals at higher trophic levels), but the pyramid of biomass would still be upright because the total biomass of the oak tree far exceeds that of the insects.
Marking scheme: 1 mark for defining pyramid of biomass. 1 mark for defining pyramid of numbers. 1 mark for explaining why pyramids of biomass are more useful (account for organism size). 1 mark for a valid example of an inverted pyramid of numbers (e.g., one tree supporting many insects/parasites).
Question 7 [6 marks]
Answer: Energy enters an ecosystem primarily through photosynthesis carried out by producers (autotrophs such as green plants, algae, and cyanobacteria). Producers convert light energy from the sun into chemical energy stored in organic molecules (e.g., glucose). This process fixes approximately 1–2% of incoming solar radiation.
Energy flows through the ecosystem via food chains and food webs. Primary consumers (herbivores) obtain energy by consuming producers. Secondary consumers (carnivores) obtain energy by consuming primary consumers, and so on up the trophic levels. At each transfer, energy is passed from one trophic level to the next.
Energy is eventually lost from the ecosystem as heat through cellular respiration at every trophic level. All organisms — producers, consumers, and decomposers — respire, converting chemical energy in organic molecules to ATP, with heat released as a byproduct. Decomposers (bacteria and fungi) break down dead organic matter and waste products, releasing the last remaining chemical energy as heat through respiration.
Energy flow is described as a one-way process rather than a cycle because energy enters as light and is progressively converted to heat at each trophic level. Heat energy cannot be reconverted into chemical energy by biological systems (this would violate the second law of thermodynamics). Unlike nutrients (carbon, nitrogen), which are recycled, energy must be continuously supplied by the sun.
Marking scheme: 1 mark for energy entering via photosynthesis by producers. 1 mark for energy flowing through food chains/webs via consumption. 1 mark for energy being lost as heat through respiration. 1 mark for the role of decomposers in releasing remaining energy. 1 mark for explaining why energy flow is one-way (heat cannot be recycled/reconverted). 1 mark for contrasting energy flow with nutrient cycling.
Common mistakes: Students may incorrectly state that energy is recycled like nutrients. The key distinction is that energy flows one-way (sun → chemical → heat) while nutrients cycle.
Section B: Nutrient Cycling
Question 8 [4 marks]
Answer: Nitrifying bacteria are chemoautotrophic bacteria that convert ammonia compounds into nitrites and then nitrates in the soil, making nitrogen available for plant uptake.
The two groups are:
-
Nitrosomonas — oxidises ammonium ions (NH4+) to nitrite ions (NO2−): 2NH4++3O2→2NO2−+4H++2H2O
-
Nitrobacter — oxidises nitrite ions (NO2−) to nitrate ions (NO3−): 2NO2−+O2→2NO3−
Both reactions release energy, which the bacteria use to fix carbon (chemoautotrophy). The nitrates produced can be absorbed by plant roots and used to synthesise amino acids and nucleotides.
Marking scheme: 1 mark for stating that nitrifying bacteria convert ammonia to nitrites/nitrates. 1 mark for naming Nitrosomonas and its reaction (ammonium → nitrite). 1 mark for naming Nitrobacter and its reaction (nitrite → nitrate). 1 mark for stating that nitrates are available for plant uptake (or that the bacteria are chemoautotrophs).
Question 9 [4 marks]
Answer: Nitrogen fixation is the process of converting atmospheric nitrogen gas (N2) into nitrogen-containing compounds (such as ammonia, NH3) that can be used by living organisms. This is essential because most organisms cannot use atmospheric N2 directly due to the strong triple bond between the two nitrogen atoms.
Free-living nitrogen-fixing bacterium: Azotobacter — found freely in soil, it converts N2 to NH3 using the enzyme nitrogenase. The ammonia is then converted to ammonium ions (NH4+) in solution, which can be used by the bacterium or other soil organisms.
Symbiotic relationship: Rhizobium bacteria live in root nodules of leguminous plants (e.g., peas, beans, clover). The bacteria fix atmospheric nitrogen into ammonia, which the plant uses to synthesise amino acids. In return, the plant provides the bacteria with carbohydrates (products of photosynthesis) and a protected, low-oxygen environment (necessary because nitrogenase is inactivated by oxygen). This is a mutualistic relationship.
Marking scheme: 1 mark for defining nitrogen fixation (conversion of N2 to usable nitrogen compounds). 1 mark for naming a free-living nitrogen-fixing bacterium (e.g., Azotobacter, Clostridium) and describing its role. 1 mark for naming Rhizobium and the legume root nodule association. 1 mark for explaining the mutualistic exchange (bacteria provide fixed nitrogen, plant provides carbohydrates/shelter).
Question 10 [7 marks total]
(a) [2 marks]
Answer: Two processes that remove carbon dioxide from the atmosphere:
- Photosynthesis — producers (plants, algae, cyanobacteria) fix atmospheric CO2 into organic compounds using light energy.
- Sedimentation / formation of fossil fuels / carbonate rock formation — carbon from dead organic matter is buried and compressed over geological time, removing it from the active carbon cycle. (Also accept: dissolution of CO2 in oceans forming carbonates.)
Marking scheme: 1 mark for each correct process identified from Fig. 10.1, up to 2 marks.
(b) [3 marks]
Answer: Human activities have disrupted the carbon cycle in the following ways:
-
Combustion of fossil fuels: Burning coal, oil, and natural gas releases carbon that was locked away underground for millions of years as CO2. This adds extra CO2 to the atmosphere faster than natural processes can remove it, increasing atmospheric CO2 concentration and contributing to the enhanced greenhouse effect and global warming.
-
Deforestation: Clearing forests reduces the number of photosynthetic organisms available to absorb atmospheric CO2. Additionally, when trees are burned or decompose, the carbon stored in their biomass is released as CO2, further increasing atmospheric carbon levels.
Marking scheme: 1 mark for each human activity identified (combustion of fossil fuels, deforestation). 1 mark for explaining the consequence of each activity on atmospheric CO2 levels.
(c) [2 marks]
Answer: The carbon cycle is described as a biogeochemical cycle because it involves:
- Biological processes (photosynthesis, respiration, decomposition, consumption) carried out by living organisms.
- Geological processes (sedimentation, fossil fuel formation, weathering of rocks, volcanic activity) involving the Earth's crust and geological formations.
- Chemical processes (combustion, dissolution, precipitation) involving chemical transformations of carbon compounds.
The term "biogeochemical" reflects the integration of biological, geological, and chemical components in the cycling of carbon through ecosystems and the wider environment.
Marking scheme: 1 mark for explaining the biological component. 1 mark for explaining the geological and/or chemical component.
Question 11 [4 marks]
Answer: Decomposition is the breakdown of dead organic matter (dead organisms, faeces, leaf litter) into simpler inorganic substances by decomposers.
Saprotrophic organisms (mainly bacteria and fungi) secrete extracellular enzymes onto dead organic matter. These enzymes hydrolyse complex organic molecules (proteins, carbohydrates, lipids, nucleic acids) into smaller, soluble molecules (amino acids, simple sugars, fatty acids, nucleotides), which the saprotrophs then absorb by absorption (osmotrophy). The saprotrophs use these molecules in their own respiration and growth.
Detritivores (e.g., earthworms, woodlice, millipedes) physically break down dead organic matter into smaller fragments by ingestion and digestion. This increases the surface area available for saprotrophic organisms to act upon, accelerating the overall decomposition process.
Decomposition is critically important in nutrient cycling because it releases essential elements (carbon, nitrogen, phosphorus, sulphur) from dead organic matter back into the soil or water in inorganic forms (e.g., CO2, NH4+, NO3−, PO43−) that can be reabsorbed by producers. Without decomposition, nutrients would remain locked in dead matter, and ecosystems would eventually run out of available nutrients.
Marking scheme: 1 mark for defining decomposition. 1 mark for describing the role of saprotrophs (extracellular digestion, absorption). 1 mark for describing the role of detritivores (physical breakdown, increasing surface area). 1 mark for explaining the importance in nutrient cycling (releases inorganic nutrients for reuptake by producers).
Question 12 [4 marks]
Answer: Fossil fuels (coal, oil, natural gas) are formed from the remains of ancient organisms that were buried and subjected to high pressure and temperature over millions of years. When these fuels are combusted, the carbon stored in them is oxidised and released as carbon dioxide:
CxHy+O2→CO2+H2O
This releases carbon that was sequestered underground over geological time scales, adding extra CO2 to the atmosphere much faster than natural carbon sinks (photosynthesis, ocean absorption) can remove it.
The enhanced greenhouse effect occurs because CO2 is a greenhouse gas. Shortwave radiation from the sun passes through the atmosphere and warms the Earth's surface. The Earth re-emits this energy as longwave infrared radiation. CO2 molecules absorb this outgoing infrared radiation and re-emit it in all directions, including back towards the Earth's surface. As atmospheric CO2 concentration increases, more infrared radiation is trapped, raising the average global temperature — this is global warming.
Marking scheme: 1 mark for explaining that combustion of fossil fuels releases ancient carbon as CO2. 1 mark for stating that this increases atmospheric CO2 concentration. 1 mark for explaining that CO2 absorbs outgoing infrared radiation. 1 mark for explaining that increased CO2 leads to more heat being trapped (enhanced greenhouse effect / global warming).
Question 13 [5 marks]
Answer: Effects on the carbon cycle:
- Trees in tropical rainforests store large amounts of carbon in their biomass. When trees are cut down and burned (or left to decompose), this stored carbon is released as CO2 into the atmosphere, increasing atmospheric CO2 concentration.
- Deforestation also removes photosynthetic organisms that would otherwise absorb CO2 from the atmosphere, reducing the ecosystem's capacity as a carbon sink.
- The soil in rainforests also stores significant carbon. Exposure of soil after deforestation increases the rate of decomposition of soil organic matter, releasing more CO2.
Effects on the nitrogen cycle:
- Trees absorb nitrates and ammonium from the soil. When trees are removed, there is no plant uptake of these ions, leading to accumulation of nitrates in the soil.
- Excess nitrates are easily leached (washed out) by rain into nearby waterways, causing eutrophication and depleting soil nitrogen.
- Without the protective tree canopy, soil is exposed to higher temperatures and increased rainfall impact, which can accelerate denitrification (conversion of nitrates back to N2 gas by denitrifying bacteria), reducing the availability of nitrogen in the soil.
- The removal of root nodules (if leguminous trees were present) eliminates symbiotic nitrogen fixation, reducing nitrogen input to the ecosystem.
Marking scheme: 1 mark for explaining carbon release from burning/decomposition of trees. 1 mark for explaining reduced CO2 absorption (loss of photosynthesis). 1 mark for explaining nitrate leaching due to lack of plant uptake. 1 mark for explaining increased denitrification or loss of nitrogen fixation. 1 mark for a well-structured, coherent answer linking both cycles to deforestation.
Section C: Populations, Biodiversity, and Environmental Issues
Question 14 [4 marks]
Answer: Carrying capacity (K) is the maximum population size of a species that an environment can sustain indefinitely, given the available resources (food, water, space, light) and environmental conditions.
Three factors that determine carrying capacity for a named species (e.g., rabbits in a grassland):
-
Food availability: The amount of grass and other vegetation limits how many rabbits can be supported. If food is scarce, the carrying capacity is lower.
-
Predation pressure: The number of predators (e.g., foxes, hawks) affects rabbit mortality. Higher predation reduces the carrying capacity.
-
Space/shelter: The availability of burrowing sites and shelter from weather and predators limits how many rabbits the habitat can support.
Marking scheme: 1 mark for correct definition of carrying capacity. 1 mark each for three valid factors (must be linked to a named species for full marks). Acceptable factors include: food, water, space, predation, disease, competition, nesting sites.
Question 15 [6 marks total]
(a) [1 mark]
Answer: The carrying capacity (K) is approximately 18 × 10⁶ cells (or 18 million cells).
Marking scheme: 1 mark for the correct value read from the graph.
(b) [2 marks]
Answer: During the log (exponential) phase, the population grows at its maximum rate because:
- Resources (nutrients, space, oxygen) are abundant and not limiting.
- There is little or no competition between individuals.
- Each cell divides at its maximum rate, and the population doubles at regular intervals, producing the characteristic exponential (J-shaped) curve.
Marking scheme: 1 mark for stating that resources are abundant/not limiting. 1 mark for explaining that the population doubles at regular intervals / grows at maximum rate.
(c) [3 marks]
Answer: The population levels off during the stationary phase because:
- Nutrients become depleted — essential nutrients (e.g., glucose, nitrogen sources) are consumed faster than they are replenished in a closed culture.
- Accumulation of toxic waste products — metabolic byproducts such as ethanol (from anaerobic respiration) or organic acids accumulate and inhibit growth.
- Competition intensifies — as population density increases, individuals compete for the remaining limited resources, reducing the per capita growth rate.
- Eventually, the birth rate equals the death rate, and the population stabilises at the carrying capacity (K).
Marking scheme: 1 mark for depletion of nutrients. 1 mark for accumulation of toxic waste products. 1 mark for competition / birth rate equals death rate.
Question 16 [4 marks]
Answer: Interspecific competition occurs between individuals of different species competing for the same limited resources (e.g., food, space, light). This can reduce the population sizes of both competing species, or one species may outcompete the other, leading to competitive exclusion. Example: Grey squirrels and red squirrels competing for the same nuts and habitat in a woodland. The grey squirrel, being larger and more efficient at foraging, may cause the red squirrel population to decline.
Intraspecific competition occurs between individuals of the same species competing for the same resources. Since conspecifics have identical resource requirements, this competition is often more intense. It regulates population size around the carrying capacity. Example: Oak trees in a forest competing for light — taller trees shade smaller ones, limiting their growth and survival, which regulates the oak population.
Marking scheme: 1 mark for defining interspecific competition (between different species). 1 mark for defining intraspecific competition (within same species). 1 mark for explaining the effect on population size for each. 1 mark for a valid example for each.
Question 17 [5 marks]
Answer: Predator-prey relationships cause population oscillations because the populations are interdependent. Using the classic example of lynx (predator) and snowshoe hare (prey) in the Canadian boreal forest:
- When the hare population is abundant, lynx have plentiful food, so the lynx population increases due to higher survival and reproductive success.
- As the lynx population grows, predation on hares intensifies, causing the hare population to decline.
- With fewer hares available, lynx face food shortage, leading to starvation, reduced reproduction, and a decline in the lynx population.
- As lynx numbers fall, predation pressure on hares decreases, allowing the hare population to recover.
- The cycle then repeats.
Predator population changes lag behind prey population changes because:
- There is a time delay between the prey population increasing and the predator population responding (predators must find mates, gestate, and produce offspring).
- Similarly, when prey decline, predators do not die immediately — they may survive for a while on remaining prey before the population crashes.
- This lag creates the characteristic out-of-phase oscillation pattern seen in predator-prey population graphs.
Marking scheme: 1 mark for describing the cyclical nature of predator-prey interactions. 1 mark for a named example. 1 mark for explaining the lag (time delay in predator response). 1 mark for explaining the mechanism of the lag (reproduction time, survival on remaining prey). 1 mark for a coherent, well-structured explanation.
Question 18 [5 marks]
Answer: Biodiversity refers to the variety of life in a given area, encompassing the range of species, genetic variation within species, and the variety of ecosystems present.
Three levels of biodiversity:
-
Species diversity — the variety of different species in an ecosystem, often measured by species richness (number of species) and species evenness (relative abundance of each species). Example: A tropical rainforest has high species diversity with thousands of plant and animal species.
-
Genetic diversity — the variety of genes within a species, including different alleles and genetic variants. Example: Different breeds of domestic dogs or different rice varieties represent genetic diversity within a species.
-
Ecosystem diversity — the variety of different habitats, biological communities, and ecological processes in a region. Example: A coastal region may include mangroves, coral reefs, sandy beaches, and seagrass beds.
Importance for ecosystem stability:
- High biodiversity increases resilience — ecosystems with many species are better able to withstand and recover from disturbances (e.g., disease, climate change) because other species can fill ecological roles if one species is lost.
- Greater species diversity means more complex food webs with redundancy — if one species is removed, others can perform similar functions, maintaining ecosystem processes (e.g., nutrient cycling, pollination).
- Genetic diversity within species allows populations to adapt to changing conditions through natural selection, reducing the risk of extinction.
Marking scheme: 1 mark for defining biodiversity. 1 mark each for describing three levels of biodiversity (species, genetic, ecosystem). 1 mark for explaining the link between biodiversity and ecosystem stability (resilience, redundancy, or adaptability).
Question 19 [7 marks total]
(a) [2 marks]
Answer: Two ways the grey squirrel might outcompete the red squirrel:
-
More efficient foraging: Grey squirrels are larger and can digest acorns and other seeds more efficiently than red squirrels, allowing them to extract more energy from the same food resources and maintain higher population densities.
-
Broader diet / greater adaptability: Grey squirrels have a wider dietary range and can exploit a greater variety of food sources, including those that red squirrels cannot utilise as effectively, giving them a competitive advantage when food is scarce.
Marking scheme: 1 mark for each valid competitive advantage, up to 2 marks. Acceptable answers include: more efficient digestion, broader diet, larger body size, higher reproductive rate, ability to store more fat, transmission of squirrelpox virus (to which grey squirrels are immune but red squirrels are susceptible).
(b) [3 marks]
Answer: The introduction of grey squirrels could affect other species in the food web:
- Predators of squirrels (e.g., birds of prey such as buzzards, pine martens) may initially benefit from an increased total squirrel population, but if red squirrels are driven to local extinction, the predator community may become less diverse.
- Tree species may be affected because grey squirrels strip bark from trees (e.g., beech, sycamore), damaging them and reducing tree health and reproduction. This could affect other species that depend on those trees for food or habitat.
- Species that compete with red squirrels for food (e.g., certain birds that feed on seeds and nuts) may face increased competition from the more abundant grey squirrel population.
- Seed dispersal dynamics may change — grey squirrels and red squirrels may cache seeds differently, affecting plant regeneration patterns.
Marking scheme: 1 mark for each valid effect on other species, up to 3 marks. Must go beyond the red squirrel to gain full marks.
(c) [2 marks]
Answer: Strategy: Targeted culling (controlled removal) of grey squirrels in areas where red squirrels are present.
Explanation: By systematically reducing the grey squirrel population in key habitats, the competitive pressure on red squirrels is reduced. This allows red squirrel populations to recover and stabilise. Culling must be sustained over time because grey squirrels can rapidly recolonise from surrounding areas. This strategy has been used in parts of the UK (e.g., in Scotland and northern England) to protect remaining red squirrel populations.
Marking scheme: 1 mark for a valid conservation strategy. 1 mark for explaining how it would work to protect red squirrels. Acceptable strategies include: culling grey squirrels, creating red-squirrel-only reserves, vaccination programmes, habitat management to favour red squirrels.
Question 20 [6 marks]
Answer: Eutrophication is the enrichment of water bodies with excess nutrients, particularly nitrates and phosphates, leading to a cascade of ecological changes.
Sequence of events:
-
Nutrient input: Excess nitrates (from agricultural fertiliser runoff) and phosphates (from sewage discharge and detergents) enter the freshwater ecosystem. These nutrients are normally limiting for plant and algal growth.
-
Algal bloom: The surplus nutrients cause rapid, excessive growth of algae (phytoplankton) on the water surface, forming a dense algal bloom. This blocks sunlight from reaching submerged aquatic plants.
-
Death of submerged plants: Submerged aquatic plants die because they can no longer photosynthesise due to reduced light penetration. This reduces oxygen production and eliminates habitat for many aquatic organisms.
-
Death of algae: Eventually, the algal population exceeds the available nutrients and begins to die off in large quantities.
-
Decomposition by aerobic bacteria: Saprotrophic aerobic bacteria decompose the dead organic matter (dead algae and dead plants). This process consumes large amounts of dissolved oxygen through bacterial respiration.
-
Oxygen depletion (hypoxia): The dissolved oxygen concentration in the water drops dramatically (hypoxic or anoxic conditions). Fish and other aerobic aquatic organisms suffocate and die due to lack of oxygen.
-
Further decomposition and ecosystem collapse: The dead fish and other organisms are further decomposed by bacteria, consuming even more oxygen. The water becomes turbid, foul-smelling, and largely devoid of aerobic life. Anaerobic bacteria may thrive, producing toxic byproducts such as hydrogen sulfide (H2S) and methane (CH4).
Management/evaluation:
Strategy: Constructed wetlands — Artificial wetlands can be built between agricultural land and water bodies. As nutrient-rich runoff passes through the wetland, plants (e.g., reeds, rushes) absorb excess nitrates and phosphates, and microbial processes (denitrification) convert nitrates to nitrogen gas. This acts as a natural buffer, reducing nutrient input into the freshwater ecosystem.
Evaluation: Constructed wetlands are effective at reducing nutrient levels and are relatively low-cost to maintain. They also provide additional biodiversity habitat. However, they require significant land area, may not cope with very high nutrient loads, and need periodic maintenance (e.g., harvesting plant biomass to remove accumulated nutrients). They are most effective as part of an integrated approach that also includes reducing fertiliser use at source.
Marking scheme: 1 mark for nutrient input (nitrates/phosphates from fertiliser/sewage). 1 mark for algal bloom and light blockage. 1 mark for death of submerged plants and algae. 1 mark for decomposition by aerobic bacteria consuming oxygen. 1 mark for oxygen depletion and death of aerobic organisms. 1 mark for a valid management strategy with evaluation.
Common mistakes: Students may describe the events out of order or omit the role of decomposers in oxygen consumption. The key concept is that it is the decomposition process (not the algae directly) that causes oxygen depletion.
Free quiz and exam paper access
Enter your details to view this paper
Your access is remembered on this device.