AI Generated Quiz
A Level H2 Biology Ecology Quiz
Free A Level H2 Biology Ecology quiz, HY3 AI version, with questions, answers, and A Level-style practice for Singapore students.
These static practice materials are generated from the site's syllabus and paper-generation workflow, with source and model context shown so students and parents can evaluate the material before use.
Questions
A-Level Biology H2 Quiz - Ecology
Name: ___________________________
Class: ___________________________
Date: ___________________________
Score: _______ / 40
Duration: 50 minutes
Total Marks: 40
Instructions: Answer all 20 questions. Section A consists of short structured questions. Section B requires data interpretation with reference to figures. Section C involves extended explanation and application. Use clear scientific terminology and show working where calculations are required.
Section A: Short Structured Questions (Questions 1–7)
1. [2 marks] Define the term ecological niche and distinguish it from habitat.
2. [2 marks] State two abiotic and two biotic factors that can limit the population size of a freshwater fish species.
Abiotic: _________________________ , _________________________
Biotic: _________________________ , _________________________
3. [2 marks] Explain the difference between gross primary productivity (GPP) and net primary productivity (NPP) using an equation.
4. [2 marks] A pond has a carrying capacity (K) of 500 for a species of snail. If the current population is 200 and the intrinsic rate of increase r = 0.1 per month, calculate the expected population growth rate (dN/dt) using the logistic model:
dtdN=rN(1−KN)
Show your working: ___________________________________________
Answer: ___________ snails/month
5. [2 marks] Name the trophic level occupied by apex predators and state one reason why their biomass is typically low.
6. [2 marks] Describe two ways in which deforestation increases atmospheric CO₂ concentration.
7. [2 marks] Using the nitrogen cycle, state the process by which Nitrosomonas bacteria convert ammonium (NH₄⁺) and the product formed.
Process: _________________________
Product: _________________________
Section B: Data Interpretation (Questions 8–14)
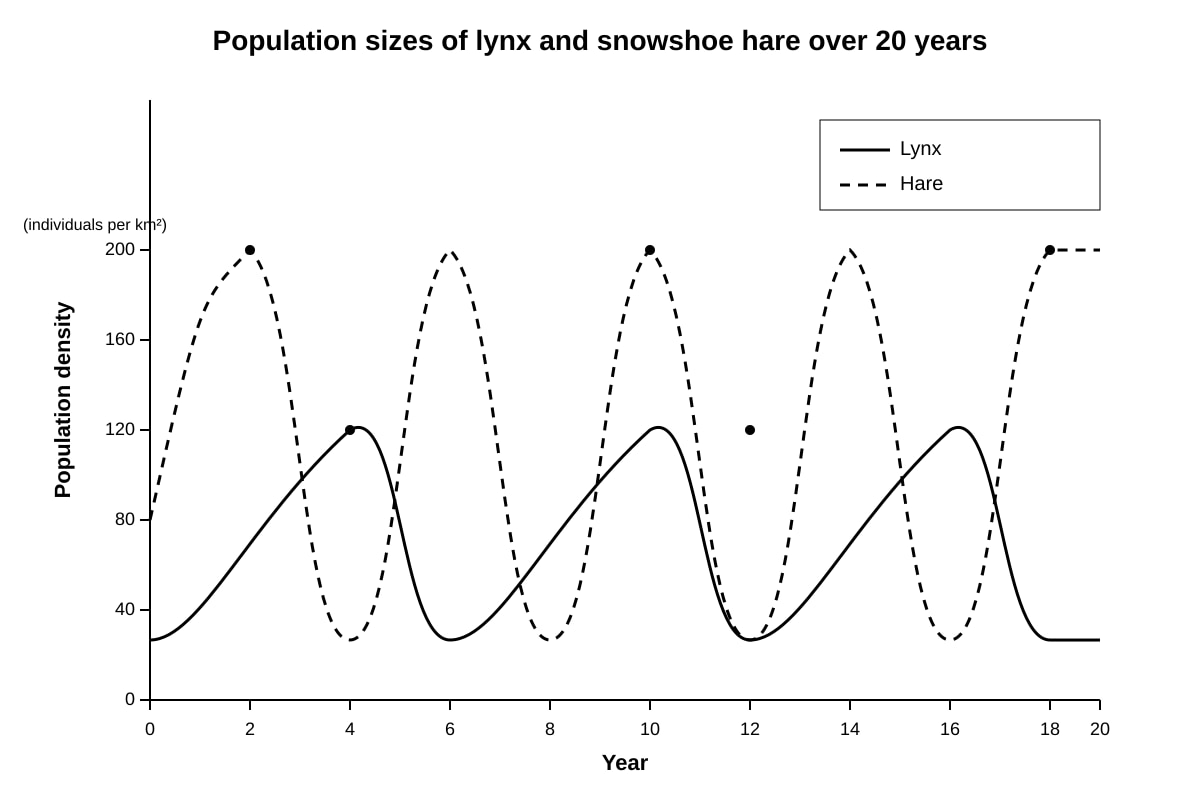
8. [3 marks] The graph below shows the population sizes of lynx and snowshoe hare over 20 years.
Image pending generation: graph for Q8.
With reference to Fig. Q8-fig1, describe the relationship between the two populations and identify the type of interaction.
9. [3 marks] A student counted species in two 10 m × 10 m quadrats in a forest. Quadrat A had 4 species with counts 20, 18, 15, 7. Quadrat B had 3 species with counts 30, 28, 2. Calculate the Simpson's Index of Diversity (D) for Quadrat A using:
D=1−∑(Nn)2 where N = total individuals.
Working: ___________________________________________________
Answer: D = ___________
10. [2 marks] State one conclusion about species evenness that can be drawn by comparing Quadrat A and B in Q9 without calculation.
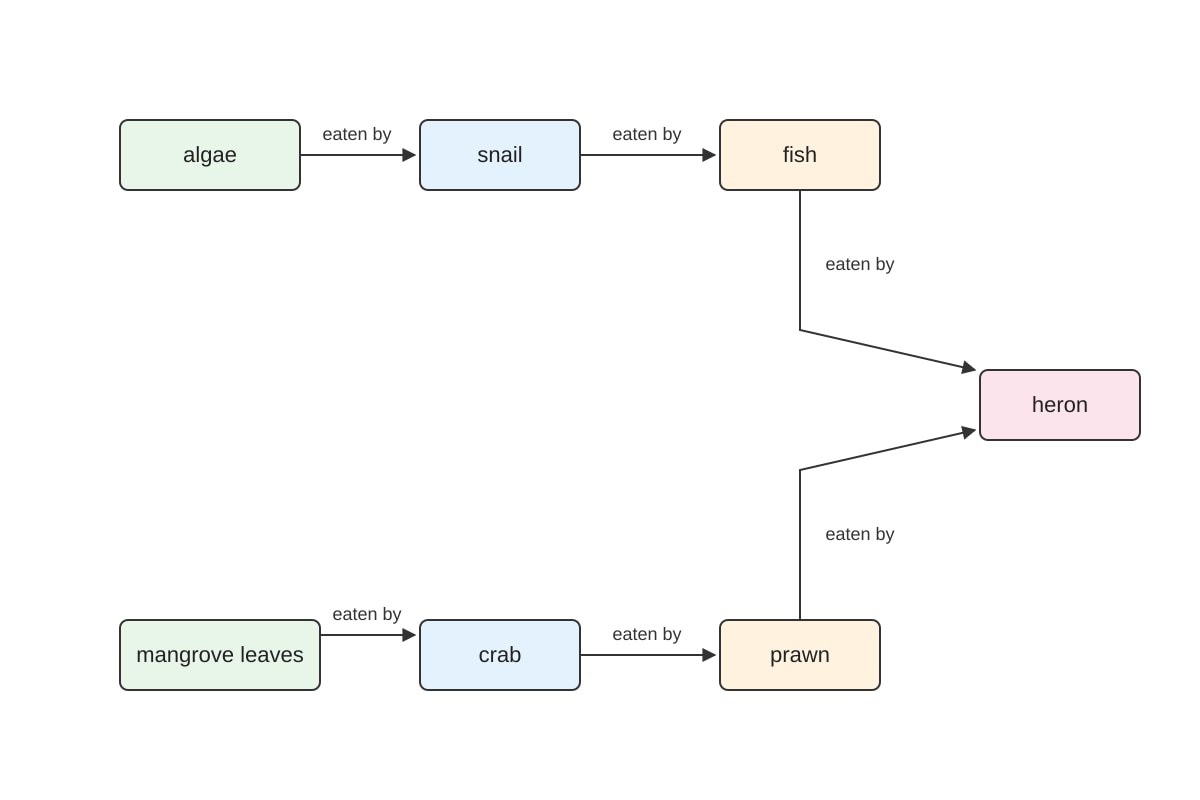
11. [3 marks] The figure shows a simplified food web in a mangrove ecosystem.
Image pending generation: diagram for Q11.
With reference to Fig. Q11-fig1, identify a quaternary consumer if present and explain your answer. If none, state the highest trophic level shown.
12. [2 marks] Explain why energy transfer between trophic levels is typically only ~10% efficient.
13. [3 marks] The table below shows dissolved oxygen (mg/L) at different temperatures in a stream.
| Temperature (°C) | O₂ saturation (mg/L) |
|---|---|
| 10 | 11.3 |
| 20 | 9.1 |
| 30 | 7.5 |
Explain the relationship and state one ecological consequence for fish if temperature rises from 20°C to 30°C due to thermal pollution.
14. [2 marks] Define biomagnification and give one example of a substance that biomagnifies.
Section C: Extended Response (Questions 15–20)
15. [2 marks] State two assumptions of the Hardy–Weinberg principle that are relevant to ecological population studies.
16. [3 marks] A population of 1000 beetles has 640 green (dominant phenotype) and 360 brown (recessive, genotype aa). Assuming Hardy–Weinberg equilibrium, calculate the frequency of the recessive allele (q) and the heterozygous carrier frequency (2pq).
Working: ___________________________________________________
q = ___________ , 2pq = ___________
17. [3 marks] Explain how climax community development in ecological succession increases species diversity, with reference to resource partitioning.
18. [3 marks] Discuss two ways climate change (Extension Topic B) can alter species distribution in a terrestrial ecosystem.
19. [3 marks] Compare r-selected and K-selected life history strategies in terms of offspring number, parental care, and population stability.
20. [3 marks] A wetland is drained for agriculture. Describe two direct and two indirect effects on local biodiversity, using ecological reasoning.
Answers
A-Level Biology H2 Quiz - Ecology: Answer Key
Total Marks: 40
Topic: Ecology (syllabus-first content; past-paper evidence for Ecology is limited to 406 blocks, so questions are generated from syllabus + AI templates, not claimed as exam-derived.)
Section A Answers
Q1 [2 marks]
- Ecological niche: the role and position of a species in its environment, including all biotic and abiotic interactions (1 mark).
- Habitat: the physical place where an organism lives (1 mark).
Teaching note: Niche is functional (what it does), habitat is locational (where it lives). Common mistake: confusing the two.
Q2 [2 marks]
Abiotic: e.g., dissolved oxygen, temperature (or pH, light) (1 mark for two).
Biotic: e.g., predation, competition (or parasitism, disease) (1 mark for two).
Marking: Any two correct abiotic and two correct biotic.
Q3 [2 marks]
Equation: NPP = GPP – R, where R = respiratory loss (1 mark).
GPP is total energy fixed by photosynthesis; NPP is energy stored as biomass after respiration (1 mark).
Teaching: GPP gross, NPP net available to next trophic level.
Q4 [2 marks]
dtdN=0.1×200×(1−200/500)=20×0.6=12 (1 mark working, 1 mark answer).
Answer: 12 snails/month.
Common mistake: Forgetting to subtract N/K from 1.
Q5 [2 marks]
Trophic level: tertiary/apex consumer (1 mark).
Reason: energy loss at each transfer limits biomass at top (1 mark).
Q6 [2 marks]
- Burning releases stored CO₂ (1 mark).
- Reduced photosynthesis/sequestration as trees removed (1 mark).
Any two valid.
Q7 [2 marks]
Process: nitrification (specifically ammonia oxidation) (1 mark).
Product: nitrite (NO₂⁻) (1 mark).
Note: Nitrosomonas: NH₄⁺ → NO₂⁻; Nitrobacter: NO₂⁻ → NO₃⁻.
Section B Answers
Q8 [3 marks]
- Hare population cycles precede lynx by ~2 years (1 mark).
- Lynx follows prey in predator–prey oscillation (1 mark).
- Interaction: predation (1 mark).
From image: lag visible, both cyclical.
Q9 [3 marks]
N = 20+18+15+7 = 60.
∑(n/N)2=(20/60)2+(18/60)2+(15/60)2+(7/60)2=0.111+0.090+0.0625+0.0136=0.277
D = 1 – 0.277 = 0.723 (1 mark N, 1 mark sum, 1 mark D).
Teaching: Higher D = more diverse.
Q10 [2 marks]
Quadrat A has more even distribution (4 species, balanced counts) than B (one dominant, one rare) (2 marks).
No calc needed; compare evenness.
Q11 [3 marks]
Highest shown: heron as apex (secondary/tertiary consumer) (1 mark).
No quaternary: heron not eaten by another (1 mark).
Explanation: only 3 transfers from producer (1 mark).
Q12 [2 marks]
~90% lost as heat/respiration, undigested matter, and not consumed (1 mark).
Only ~10% assimilated to biomass (1 mark).
Q13 [3 marks]
Inverse relationship: O₂ solubility decreases with temperature (1 mark).
At 30°C, 7.5 mg/L vs 9.1 at 20°C (1 mark).
Consequence: hypoxia stress, fish death if demand exceeds supply (1 mark).
Q14 [2 marks]
Biomagnification: increasing concentration of substance up food chain (1 mark).
Example: DDT, mercury (1 mark).
Section C Answers
Q15 [2 marks]
- No migration (1 mark).
- No selection/random mating/large population (1 mark).
Any two H-W assumptions.
Q16 [3 marks]
q² = 360/1000 = 0.36 → q = 0.6 (1 mark).
p = 0.4 → 2pq = 2×0.4×0.6 = 0.48 (1 mark value, 1 mark stated).
Answer: q = 0.6, 2pq = 0.48 (48%).
Q17 [3 marks]
Succession adds layers/niches (1 mark).
Resource partitioning reduces competition (1 mark).
More species coexist → diversity rises (1 mark).
Q18 [3 marks]
- Warming shifts ranges poleward/uphill (1 mark + example).
- Altered phenology mismatches breeding/food (1 mark).
- Extreme weather reduces habitat (1 mark).
Any two with reasoning.
Q19 [3 marks]
r-selected: many offspring, little care, unstable pops (1 mark).
K-selected: few offspring, high care, stable near K (1 mark).
Comparison stated (1 mark).
Q20 [3 marks]
Direct: habitat loss for aquatic species, reduced wetland plants (1 mark each).
Indirect: nutrient runoff, downstream flood increase (1 mark for two).
Need 2 direct + 2 indirect = 3 marks split.
Free quiz and exam paper access
Enter your details to view this paper
Your access is remembered on this device.