From Real Exams Quiz
A Level H2 Biology Plant Biology Quiz
Free A Level H2 Biology Plant Biology quiz, LongCat Exam version, with questions, answers, and A Level-style practice for Singapore students.
These static practice materials are generated from the site's syllabus and paper-generation workflow, with source and model context shown so students and parents can evaluate the material before use.
Questions
A-Level Biology H2 Quiz - Plant Biology
Name: ___________________________
Class: ___________________________
Date: ___________________________
Score: ________ / 50
Duration: 60 minutes
Total Marks: 50
Instructions:
- Answer ALL questions in the spaces provided.
- The number of marks for each question or part-question is shown in brackets [ ].
- You are advised to spend no more than 60 minutes on this quiz.
- Where a question requires an explanation or description, use precise biological terminology.
- For questions involving calculations, show all working and include appropriate units.
Section A: Multiple Choice & Short Answer (Questions 1–10)
Questions 1–5: Multiple Choice. Circle the single best answer. Each question carries 1 mark.
1. Which of the following correctly describes the role of photosystem II in the light-dependent reactions of photosynthesis?
(a) It absorbs light at 700 nm and passes excited electrons directly to NADP⁺ reductase.
(b) It catalyses the photolysis of water and releases oxygen as a by-product.
(c) It fixes carbon dioxide into glycerate 3-phosphate using the enzyme Rubisco.
(d) It synthesises ATP by chemiosmosis using protons from the stroma.
2. In a C₃ plant under conditions of high temperature and bright sunlight, photorespiration increases primarily because:
(a) Rubisco binds oxygen instead of carbon dioxide as the O₂:CO₂ ratio in the leaf increases.
(b) The stomata open wider, allowing excess oxygen to enter the mesophyll.
(c) PEP carboxylase outcompetes Rubisco for carbon dioxide fixation.
(d) The Calvin cycle is inhibited by the accumulation of glyceraldehyde 3-phosphate.
3. Which structural feature of xylem vessels most directly facilitates the continuous upward transport of water under tension?
(a) Living cytoplasm that actively pumps water molecules.
(b) Perforation plates and lignified walls that prevent collapse under negative pressure.
(c) Companion cells that maintain the metabolic activity of sieve tube elements.
(d) Sieve plates that allow lateral movement of water between adjacent vessels.
4. A student treats a detached leaf with a solution of abscisic acid (ABA). Which of the following is the most likely observable effect?
(a) Rapid elongation of the leaf petiole.
(b) Promotion of lateral bud growth.
(c) Closure of stomata on the leaf surface.
(d) Delayed senescence and chlorophyll retention.
5. In the translocation of sucrose through the phloem, which process occurs at the sink?
(a) Sucrose is actively loaded into sieve tube elements, lowering the water potential.
(b) Water enters the phloem by osmosis, generating high turgor pressure.
(c) Sucrose is removed from the phloem, raising the water potential and causing water to leave by osmosis.
(d) Proton pumps actively transport sucrose against its concentration gradient into companion cells.
Questions 6–10: Short Answer. Each question carries 2–3 marks.
6. State two structural adaptations of xylem vessels that make them efficient for water transport. [2]
7. Distinguish between the terms transpiration and translocation in plants. [2]
8. Explain why the rate of transpiration decreases when atmospheric humidity increases. [2]
9. Name the two products of the light-dependent reactions that are required for the Calvin cycle, and state the role of each in the Calvin cycle. [2]
10. Describe one piece of evidence that supports the cohesion-tension theory of water transport in the xylem. [2]
Section B: Structured Response (Questions 11–17)
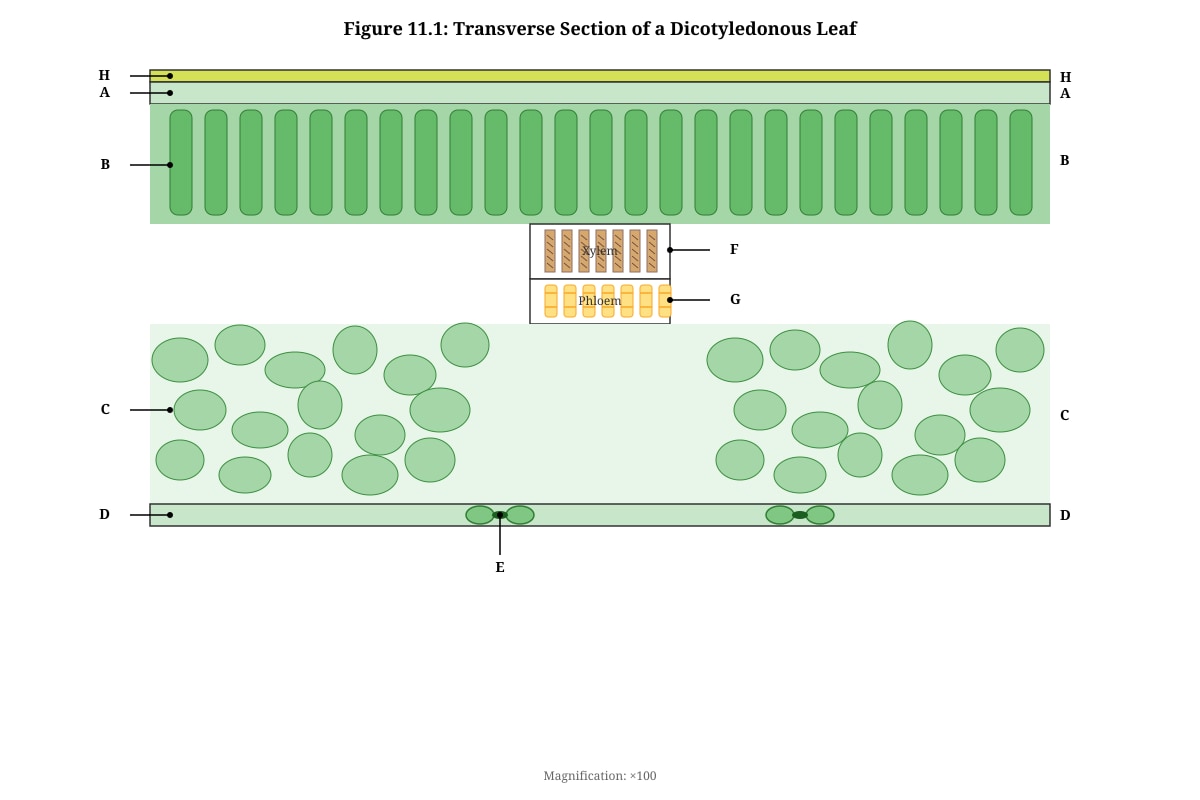
11. Figure 11.1 shows a transverse section of a dicotyledonous leaf as seen under a light microscope.
Generated diagram for Q11.
(a) With reference to Figure 11.1, identify the tissues labelled B and G. [2]
B: _________________________________________________________________________
G: _________________________________________________________________________
(b) Explain how the structure of tissue B is adapted for its function in photosynthesis. [3]
(c) Explain the significance of the air spaces in tissue C for gas exchange. [2]
12. An experiment was carried out to investigate the effect of light intensity on the rate of photosynthesis in Elodea (an aquatic plant). The number of oxygen bubbles produced per minute was counted at different light intensities. The results are shown in Table 12.1.
Image pending generation: table for Q12.
(a) With reference to Table 12.1, describe the relationship between light intensity and the rate of photosynthesis as measured by oxygen bubble production. [2]
(b) Explain why the rate of oxygen bubble production plateaus at light intensities of 60 arbitrary units and above. [3]
(c) State one other factor, apart from light intensity, that could become the limiting factor at high light intensities. [1]
13. Figure 13.1 shows a simplified diagram of the pressure flow hypothesis for translocation in the phloem.
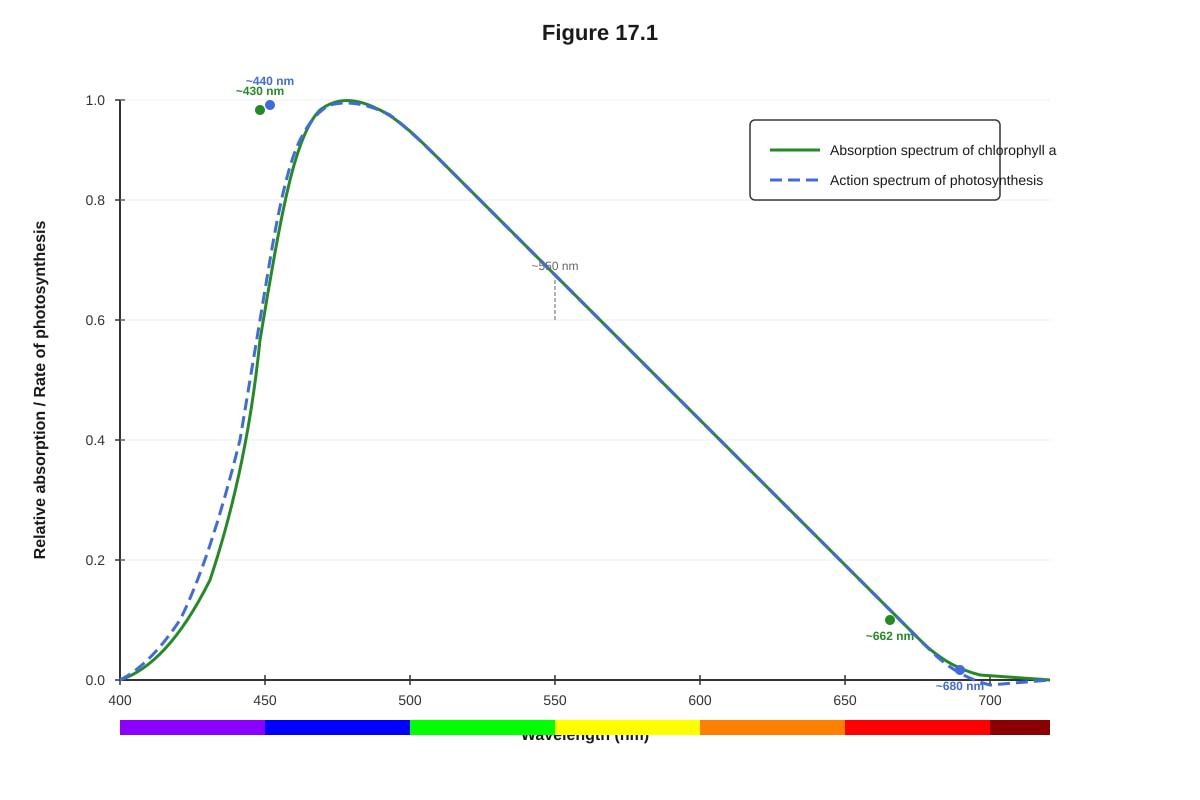
Generated graph for Q17.
(a) With reference to Figure 17.1, describe the relationship between the absorption spectrum of chlorophyll a and the action spectrum of photosynthesis. [2]
(b) Explain why the action spectrum is broader than the absorption spectrum of chlorophyll a. [2]
(c) Explain why leaves appear green. [1]
Section C: Data Interpretation & Extended Response (Questions 18–20)
18. A study was carried out to investigate the effect of different concentrations of gibberellic acid (GA₃) on the germination of dormant barley seeds. Seeds were soaked in solutions of GA₃ at various concentrations for 24 hours, then placed on moist filter paper. The percentage of seeds that germinated after 5 days was recorded. The results are shown in Table 18.1.
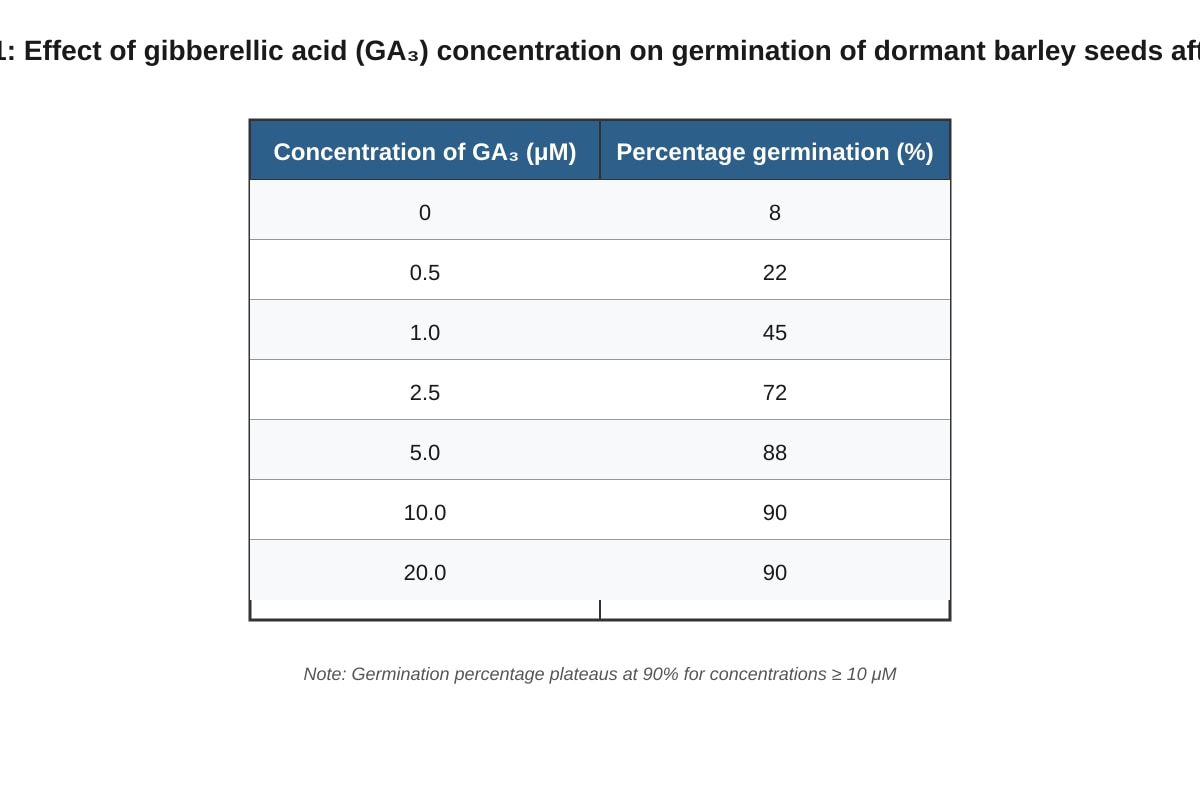
Generated table for Q18.
(a) Plot a graph of percentage germination against GA₃ concentration on the grid provided below. [3]
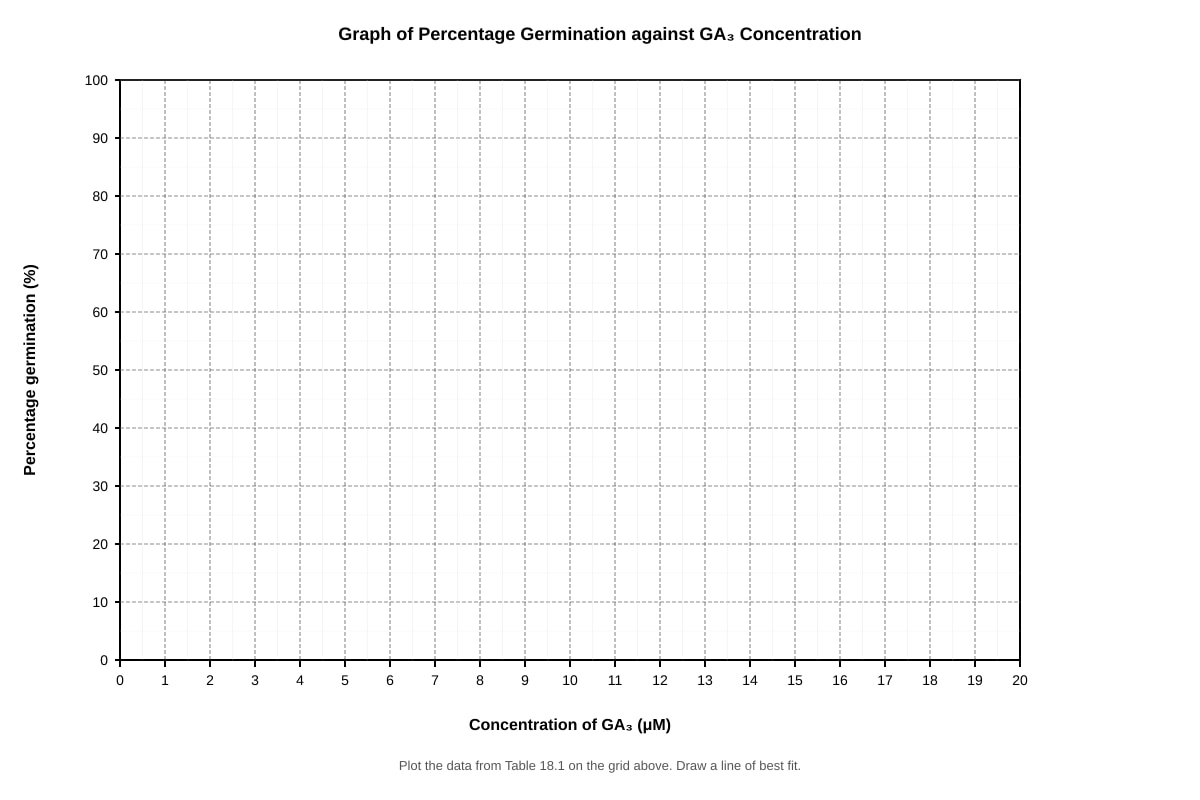
Generated graph for Q18.
(b) Describe the trend shown by the data in Table 18.1. [2]
(c) Explain the role of gibberellic acid in breaking seed dormancy and promoting germination. [3]
(d) Suggest why the percentage germination plateaus at GA₃ concentrations above 10 μM. [1]
19. A farmer noticed that tomato plants grown in a greenhouse with supplementary blue and red LED lighting produced significantly more fruit than plants grown under white fluorescent lighting of the same total light intensity.
Using your knowledge of photosynthesis and plant pigments, explain this observation. [5]
20. Compare and contrast the transport systems in flowering plants and mammals. In your answer, refer to the following:
- the substances transported
- the structures involved
- the mechanisms driving transport
- the direction of transport [8]
Answers
A-Level Biology H2 Quiz - Plant Biology
Answer Key
Question 1
Answer: (b)
Marks: 1
Photosystem II (PSII) absorbs light at 680 nm (P680) and catalyses the photolysis (splitting) of water molecules, releasing oxygen, protons, and electrons. The electrons replace those lost from the reaction centre when light excites them. Option (a) describes photosystem I (PSI, P700). Option (c) describes the Calvin cycle (light-independent reactions). Option (d) describes ATP synthase activity, not PSII directly.
Common mistake: Students often confuse the roles of PSI and PSII. Remember: PSII splits water first in the electron transport chain; PSI passes electrons to NADP⁺ reductase.
Question 2
Answer: (a)
Marks: 1
Rubisco is a bifunctional enzyme (it can act as both a carboxylase and an oxygenase). At high temperatures, the solubility of CO₂ decreases relative to O₂, and the O₂:CO₂ ratio in the leaf increases. Rubisco increasingly binds O₂ instead of CO₂, initiating photorespiration. Option (b) is incorrect because stomata tend to close in hot, dry conditions. Option (c) describes C₄ plants, not C₃ plants. Option (d) is not the primary cause of increased photorespiration.
Common mistake: Students may think photorespiration is caused by excess O₂ entering through stomata, but the key factor is the relative affinity of Rubisco for O₂ vs CO₂ at the active site.
Question 3
Answer: (b)
Marks: 1
Xylem vessels are dead, hollow tubes with lignified secondary walls that resist collapse under the negative pressure (tension) generated by transpiration pull. Perforation plates at the ends of vessel elements allow continuous water columns to form. Option (a) is incorrect because xylem vessels lack living cytoplasm. Option (c) describes companion cells associated with phloem. Option (d) describes sieve plates in phloem, not xylem.
Common mistake: Students sometimes confuse xylem and phloem structures. Xylem = dead, lignified, transports water/minerals upward. Phloem = living sieve tubes, transports sucrose/organic compounds bidirectionally.
Question 4
Answer: (c)
Marks: 1
Abscisic acid (ABA) is a plant stress hormone that triggers stomatal closure by causing guard cells to lose potassium ions (K⁺), which leads to water loss by osmosis, decreased turgor, and closure of the stomatal pore. This reduces water loss during drought. Option (a) is associated with auxin or gibberellins. Option (b) is associated with reduced auxin (apical dominance removal) or cytokinins. Option (d) is associated with cytokinins.
Common mistake: Students may confuse ABA with auxin. ABA = stress response, stomatal closure, dormancy. Auxin = cell elongation, apical dominance, tropisms.
Question 5
Answer: (c)
Marks: 1
At the sink, sucrose is actively removed from the sieve tube elements (e.g., by respiration, conversion to starch, or active uptake by sink cells). This raises the water potential inside the sieve tube, causing water to leave by osmosis back into the xylem, lowering the turgor pressure at the sink. Option (a) and (b) describe events at the source. Option (d) describes loading at the source, not removal at the sink.
Common mistake: Students often confuse source and sink events. Source = sucrose loaded IN, water enters, high pressure. Sink = sucrose removed, water leaves, low pressure.
Question 6
Marks: 2
Two structural adaptations of xylem vessels for efficient water transport:
- Lignified cell walls – Lignin provides mechanical strength and prevents the vessels from collapsing under the negative pressure (tension) generated by transpiration pull. [1]
- Hollow, open-ended tubes (no cytoplasm or end walls / perforation plates) – The absence of cell contents and the presence of perforation plates allow a continuous column of water to flow with minimal resistance. [1]
Alternative acceptable answers:
- Narrow lumen provides greater capillary action.
- Pits in the walls allow lateral movement of water between vessels.
Marking note: 1 mark per correct adaptation. Vague answers such as "strong walls" without mentioning lignin do not earn the mark.
Question 7
Marks: 2
| Feature | Transpiration | Translocation |
|---|---|---|
| Substance transported | Water (and dissolved mineral ions) | Mainly sucrose and amino acids |
| Tissue involved | Xylem | Phloem (sieve tube elements) |
| Direction | Unidirectional – upward from roots to leaves | Bidirectional – from source to sink |
| Driving force | Transpiration pull (evaporation from leaves creates tension) | Pressure flow (osmotic pressure gradient between source and sink) |
Marking note: Award 1 mark for each valid distinction, up to a maximum of 2 marks. Students must compare both terms in each point made.
Question 8
Marks: 2
When atmospheric humidity increases, the water vapour concentration gradient between the air spaces inside the leaf (near saturation) and the surrounding air decreases. [1] This reduces the rate of evaporation of water from the mesophyll cell surfaces and diffusion of water vapour out through the stomata, thereby decreasing the rate of transpiration. [1]
Common mistake: Students may state "less water evaporates" without explaining the reduced concentration gradient. The gradient is the key concept.
Question 9
Marks: 2
- ATP – Provides energy for the phosphorylation of glycerate 3-phosphate (GP) to glyceraldehyde 3-phosphate (G3P) and for the regeneration of ribulose bisphosphate (RuBP) in the Calvin cycle. [1]
- NADPH (reduced NADP) – Provides reducing power (electrons and hydrogen ions) to reduce glycerate 3-phosphate (GP) to glyceraldehyde 3-phosphate (G3P). [1]
Common mistake: Students may write "NADP" instead of "NADPH" or "reduced NADP." The reduced form is required. Also, students sometimes confuse the roles — ATP provides energy; NADPH provides reducing power.
Question 10
Marks: 2
One piece of evidence supporting the cohesion-tension theory:
- The diameter of tree trunks decreases slightly during the day when transpiration rates are highest. This is because the increased tension in the xylem pulls the water columns inward, causing the xylem walls (and the trunk) to shrink slightly. [2]
Alternative acceptable answers:
- If a xylem vessel is broken (e.g., by cutting a stem), air is drawn into the vessel rather than water leaking out, demonstrating that the water column is under tension.
- The fact that water can be pulled to the top of the tallest trees (>100 m) is consistent with the cohesive properties of water (hydrogen bonding) maintaining an unbroken column under tension.
Marking note: Award 2 marks for a clearly explained piece of evidence. 1 mark for stating the evidence without explanation.
Question 11
(a) Marks: 2
B: Palisade mesophyll [1]
G: Phloem [1]
(b) Marks: 3
The palisade mesophyll cells are adapted for photosynthesis in the following ways:
- They are located near the upper surface of the leaf, where light intensity is highest, maximising light absorption. [1]
- They contain a large number of chloroplasts (more than spongy mesophyll cells), which house the photosynthetic pigments and enzymes needed for the light-dependent and light-independent reactions. [1]
- The cells are elongated and tightly packed in a vertical orientation, which allows efficient capture of light passing through the leaf and maximises the surface area for gas exchange. [1]
Marking note: 1 mark per valid adaptation point, up to 3 marks. The answer must link structure to function.
(c) Marks: 2
The air spaces in the spongy mesophyll allow carbon dioxide (CO₂) to diffuse rapidly from the stomata to the photosynthesising cells. [1] They also allow oxygen (O₂), produced during photosynthesis, to diffuse out of the leaf. The large surface area of the irregularly shaped cells surrounding the air spaces increases the area available for gas exchange. [1]
Common mistake: Students may state "air spaces allow gas exchange" without explaining the diffusion pathway or the role of the large surface area.
Question 12
(a) Marks: 2
As light intensity increases from 10 to 60 arbitrary units, the mean number of oxygen bubbles per minute increases from 2 to 20, indicating that the rate of photosynthesis increases with light intensity. [1] At light intensities of 60 arbitrary units and above, the rate plateaus at 20 bubbles per minute, indicating that light intensity is no longer the limiting factor. [1]
(b) Marks: 3
At light intensities above 60 arbitrary units, the rate of photosynthesis no longer increases because another factor becomes limiting. [1] The light-dependent reactions are producing ATP and NADPH at a maximum rate, but the Calvin cycle (light-independent reactions) cannot proceed any faster. [1] This may be because the concentration of carbon dioxide is insufficient, or because the temperature is not optimal for the enzymes involved in the Calvin cycle (e.g., Rubisco). [1]
Marking note: Award 1 mark for identifying that another factor becomes limiting, 1 mark for linking to the Calvin cycle, and 1 mark for naming a specific limiting factor.
(c) Marks: 1
Carbon dioxide concentration (or temperature) [1]
Question 13
(a) Marks: 3
At the source, sucrose is actively loaded into the sieve tube elements by companion cells (via proton-sucrose co-transport). [1] This lowers the water potential inside the sieve tube. [1] Water then moves by osmosis from the adjacent xylem (which has a higher water potential) into the sieve tube, increasing the turgor pressure inside the sieve tube. [1]
(b) Marks: 2
At the sink, sucrose is removed from the sieve tube (by active transport or diffusion into sink cells for respiration or storage). [1] This raises the water potential inside the sieve tube at the sink, causing water to leave by osmosis back into the xylem, lowering the turgor pressure at the sink. The difference in turgor pressure between source and sink creates the pressure gradient that drives translocation. [1]
(c) Marks: 1
The aphid stylet experiment – When an aphid inserts its stylet into a sieve tube, sap exudes under pressure, demonstrating that the phloem contents are under positive pressure. [1]
Alternative acceptable answers:
- Radioactive carbon-14 tracing shows that sucrose moves from source to sink tissues.
- The concentration of sucrose is higher in source leaves than in sink tissues, consistent with a pressure gradient.
Question 14
(a) Marks: 2
- Mesophyll cells – contain the enzyme PEP carboxylase (phosphoenolpyruvate carboxylase), which fixes CO₂ into oxaloacetate (a 4-carbon compound). [1]
- Bundle sheath cells – contain the enzyme Rubisco (ribulose bisphosphate carboxylase/oxygenase), which fixes CO₂ in the Calvin cycle. [1]
(b) Marks: 4
In hot, dry environments, C₃ plants close their stomata to conserve water, which reduces the CO₂ concentration in the leaf and increases photorespiration. [1] In C₄ plants, PEP carboxylase in the mesophyll cells has a very high affinity for CO₂ and can fix CO₂ efficiently even at low concentrations. [1] The 4-carbon compound (malate/aspartate) is transported to the bundle sheath cells, where it releases CO₂ at a high concentration around Rubisco. [1] This high local CO₂ concentration suppresses photorespiration, allowing the Calvin cycle to proceed efficiently even when stomata are partially closed. [1]
Marking note: Award 1 mark per valid point. The answer must explain the advantage in terms of CO₂ concentration and suppression of photorespiration.
Question 15
Marks: 5
When a plant shoot is exposed to unilateral (one-sided) light, auxin (indole-3-acetic acid, IAA) accumulates on the shaded side of the shoot tip. [1] This redistribution occurs because light causes auxin to be transported laterally from the illuminated side to the shaded side (and/or because auxin is degraded on the illuminated side). [1] The higher concentration of auxin on the shaded side promotes greater cell elongation in the cells below the tip on that side. [1] Auxin stimulates the activation of proton pumps (H⁺-ATPases) in the plasma membrane, which acidify the cell wall (acid growth hypothesis), activating expansins that loosen the cell wall and allowing turgor-driven cell expansion. [1] Because the shaded side elongates more than the illuminated side, the shoot bends towards the light. [1]
Marking note: Award 1 mark per valid point. The answer must include: auxin redistribution to shaded side, promotion of cell elongation, mechanism of cell elongation (acid growth or equivalent), and differential growth causing bending.
Question 16
Marks: 4
The fan increases air movement across the leaf surface, which removes water vapour from around the stomata. [1] This increases the water vapour concentration gradient between the saturated air spaces inside the leaf and the surrounding air, increasing the rate of transpiration. [1] The increased transpiration rate increases the tension (negative pressure) in the xylem water column. [1] Due to the cohesive properties of water (hydrogen bonding), this tension is transmitted down the continuous water column in the xylem to the roots, pulling more water up from the roots and increasing the rate of water uptake. [1]
Marking note: Award 1 mark per valid point. The answer must link fan → increased transpiration → increased tension → increased water uptake via cohesion-tension.
Question 17
(a) Marks: 2
Both spectra show peaks in the blue (~430–440 nm) and red (~660–680 nm) regions of the visible spectrum, and both show a trough in the green region (~500–550 nm). [1] However, the action spectrum is broader than the absorption spectrum of chlorophyll a, meaning that wavelengths not strongly absorbed by chlorophyll a (e.g., in the orange and far-red regions) still contribute to photosynthesis. [1]
(b) Marks: 2
The action spectrum is broader because photosynthesis is driven by multiple photosynthetic pigments, not just chlorophyll a. [1] Accessory pigments such as chlorophyll b, carotenoids (carotene and xanthophyll), and phycobilins (in some organisms) absorb light at different wavelengths and transfer the energy to chlorophyll a via resonance energy transfer, thereby extending the range of wavelengths that can drive photosynthesis. [1]
(c) Marks: 1
Leaves appear green because chlorophyll a and chlorophyll b absorb light most strongly in the blue and red regions of the spectrum, but reflect (and transmit) green light (~500–550 nm), which is detected by our eyes. [1]
Question 18
(a) Marks: 3
Marking criteria for the graph:
- Correctly labelled axes with units (x-axis: Concentration of GA₃ / μM; y-axis: Percentage germination / %) — [1]
- Appropriate scale used (x-axis 0–20 μM; y-axis 0–100%) — [1]
- All points correctly plotted and a smooth curve or line drawn through the points, showing the increasing trend and plateau — [1]
Expected data points to be plotted: (0, 8), (0.5, 22), (1.0, 45), (2.5, 72), (5.0, 88), (10.0, 90), (20.0, 90)
(b) Marks: 2
As the concentration of GA₃ increases from 0 to 10 μM, the percentage germination increases from 8% to 90%. [1] Above 10 μM, the percentage germination plateaus at 90%, indicating that increasing GA₃ concentration beyond this point does not further increase germination. [1]
(c) Marks: 3
Gibberellic acid breaks seed dormancy by stimulating the synthesis of hydrolytic enzymes (e.g., α-amylase) in the aleurone layer of the seed. [1] These enzymes break down stored starch in the endosperm into sugars (e.g., glucose), which provide energy and carbon skeletons for the growing embryo. [1] GA₃ also promotes cell division and elongation in the embryo, enabling the radicle to emerge and germination to proceed. [1]
Marking note: Award 1 mark for enzyme synthesis in aleurone layer, 1 mark for starch breakdown providing energy, 1 mark for promotion of embryo growth.
(d) Marks: 1
At concentrations above 10 μM, all available GA₃ receptors in the aleurone layer are saturated (or all seeds that are capable of responding to GA₃ have already been stimulated), so further increases in concentration have no additional effect. [1]
Alternative answer: The maximum germination potential of the seed batch is 90% (some seeds may be non-viable for reasons unrelated to GA₃).
Question 19
Marks: 5
Chlorophyll a and chlorophyll b absorb light most efficiently in the blue (~430–450 nm) and red (~640–680 nm) regions of the visible spectrum. [1] Blue and red LED lighting provides light at wavelengths that closely match the absorption peaks of the main photosynthetic pigments, maximising light absorption and the rate of the light-dependent reactions. [1] White fluorescent lighting emits light across the entire visible spectrum, including green light (~500–550 nm), which is poorly absorbed by chlorophyll and is largely reflected or transmitted. [1] Therefore, a significant proportion of the energy from white fluorescent lighting is wasted as it is not used for photosynthesis. [1] With more efficient light absorption under blue and red LEDs, more ATP and NADPH are produced, driving a faster Calvin cycle, greater production of glyceraldehyde 3-phosphate, and ultimately more synthesis of organic molecules (including sugars and amino acids) that support fruit development. [1]
Marking note: Award 1 mark per valid point. The answer must compare the spectral output of the two light sources and link to photosynthetic efficiency and fruit production.
Question 20
Marks: 8
Substances transported:
- In plants: water and mineral ions (in xylem); sucrose, amino acids, and other organic solutes (in phloem).
- In mammals: oxygen, carbon dioxide, nutrients (glucose, amino acids, fatty acids), hormones, urea, and other waste products (in blood).
Structures involved:
- In plants: xylem vessels (dead, hollow, lignified) for water/minerals; phloem sieve tube elements (living, with companion cells) for organic solutes.
- In mammals: blood vessels (arteries, veins, capillaries) and the heart (muscular pump) for blood.
Mechanisms driving transport:
- In plants: Transpiration pull (cohesion-tension) drives xylem transport — evaporation from leaves creates tension, and cohesive water molecules are pulled up as a continuous column. Pressure flow (osmotic gradient between source and sink) drives phloem transport.
- In mammals: The heart generates blood pressure (hydrostatic pressure) by rhythmic contraction (systole), which pushes blood through the circulatory system. Valves prevent backflow.
Direction of transport:
- In plants: Xylem transport is unidirectional (upward from roots to leaves). Phloem transport is bidirectional (from source to sink, which can be upward or downward depending on the season and plant needs).
- In mammals: Blood flows in a closed, double circulatory system — pulmonary circulation (heart → lungs → heart) and systemic circulation (heart → body → heart). Flow through any given vessel is unidirectional.
Similarities:
- Both systems use tubular structures (xylem/phloem in plants; blood vessels in mammals).
- Both involve the transport of water and dissolved substances.
- Both rely on pressure gradients to drive flow.
Differences:
- Plants use passive mechanisms (transpiration pull, osmotic pressure) and do not require a muscular pump; mammals use an active muscular pump (heart).
- Xylem transport is passive and does not require living cells; mammalian circulation requires living cells (blood cells, endothelial cells).
- Plant transport is driven partly by external environmental factors (light, humidity, temperature); mammalian transport is internally regulated (heart rate, vasoconstriction/vasodilation).
Marking note: Award 1 mark per valid comparison point, up to a maximum of 8 marks. The answer must address all four bullet points (substances, structures, mechanisms, direction) and include at least one similarity and one difference for full marks. Responses that are purely descriptive of one organism without comparison will be capped at 4 marks.
Free quiz and exam paper access
Enter your details to view this paper
Your access is remembered on this device.