From Real Exams Quiz
A Level H2 Biology Human Physiology Quiz
Free A Level H2 Biology Human Physiology quiz, LongCat Exam version, with questions, answers, and A Level-style practice for Singapore students.
These static practice materials are generated from the site's syllabus and paper-generation workflow, with source and model context shown so students and parents can evaluate the material before use.
Questions
A-Level Biology H2 Quiz - Human Physiology
Name: ___________________________
Class: ___________________________
Date: ___________________________
Score: ________ / 60
Duration: 60 minutes
Total Marks: 60
Instructions:
- Answer ALL questions in the spaces provided.
- The number of marks for each question or part-question is shown in brackets [ ].
- You are advised to spend no more than 60 minutes on this quiz.
- Where a question requires an explanation or description, use precise biological terminology.
- For questions involving data interpretation, show your working and reasoning clearly.
Section A: Short Answer Questions (20 marks)
Questions 1–10
1. State two structural features of a motor neurone that are adapted for its function in transmitting nerve impulses over long distances. [2]
2. Distinguish between the terms hormone and neurotransmitter in terms of their mode of transport and speed of action. [2]
3. Name the type of feedback mechanism involved when blood glucose concentration is restored to normal after a meal. Explain why this type of feedback is important in homeostasis. [2]
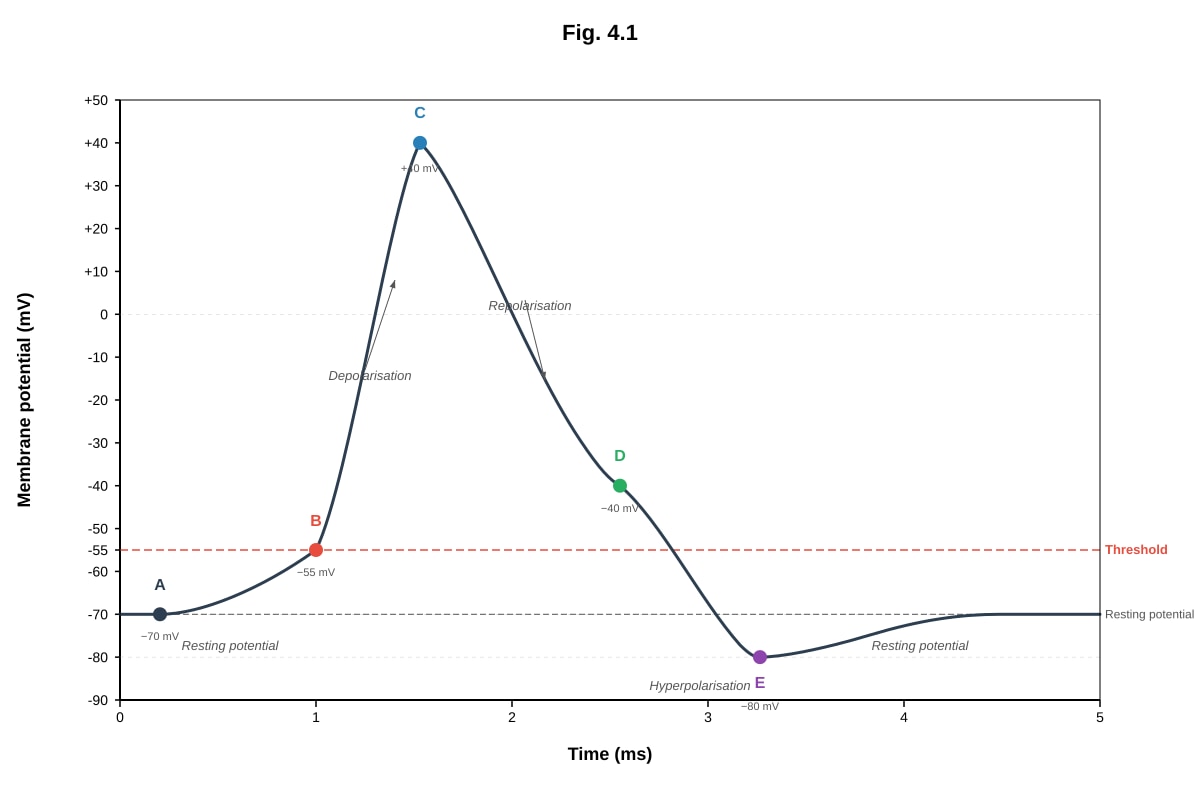
4. Fig. 4.1 shows the changes in membrane potential in a neurone during the generation of an action potential.
Generated graph for Q4.
(a) With reference to Fig. 4.1, state the membrane potential at point B and explain what is happening at this point. [2]
(b) Explain the change in membrane potential between points C and D. [2]
5. State two roles of the hormone aldosterone in the regulation of blood pressure and osmotic balance. [2]
6. Explain what is meant by the term partial pressure and state how the partial pressure of oxygen (pO2) in the alveoli facilitates oxygen uptake by red blood cells. [2]
7. Describe the role of the sinoatrial node (SAN) in the cardiac cycle. [2]
8. Name the cells responsible for the secretion of hydrochloric acid in the stomach and explain how the stomach lining is protected from autodigestion. [2]
9. Outline two ways in which the structure of a villus in the small intestine is adapted for efficient absorption of nutrients. [2]
10. State the role of each of the following in the immune response: [2]
(a) B lymphocytes
(b) T helper cells
Section B: Structured Questions (25 marks)
Questions 11–17
11. Fig. 11.1 shows the hormonal regulation of the menstrual cycle.
Image pending generation: graph for Q11.
(a) With reference to Fig. 11.1, describe the changes in the levels of luteinising hormone (LH) and progesterone during the menstrual cycle. [3]
(b) Explain the role of the LH surge in the event occurring at day 14. [2]
(c) Explain how the rise in progesterone after day 14 provides negative feedback to the pituitary gland. [2]
(d) A woman is given a contraceptive pill containing synthetic progesterone. Explain how this prevents pregnancy. [3]
12. An investigation was carried out to study the effect of exercise on heart rate and cardiac output. A healthy student rested for 5 minutes and then exercised on a bicycle ergometer for 10 minutes. Heart rate and stroke volume were measured at rest and during exercise. The results are shown in Table 12.1.
Table 12.1
| Parameter | At rest | During exercise |
|---|---|---|
| Heart rate / beats min⁻¹ | 72 | 145 |
| Stroke volume / cm³ | 70 | 110 |
(a) Define the term cardiac output. [1]
(b) Calculate the cardiac output of the student at rest and during exercise. Show your working. [2]
(c) Explain the physiological advantage of the change in cardiac output during exercise. [2]
(d) Describe the role of the sympathetic nervous system in bringing about the changes in heart rate and stroke volume during exercise. [3]
13. Fig. 13.1 shows a section through the human kidney, including a nephron and its associated blood vessels.
Image pending generation: diagram for Q13.
(a) With reference to Fig. 13.1, explain how ultrafiltration occurs in the Bowman's capsule. Your answer should include the role of the afferent and efferent arterioles. [3]
(b) Explain how the loop of Henle enables the production of concentrated urine. [4]
(c) State one substance that is completely reabsorbed in the proximal convoluted tubule and explain how this is achieved. [2]
14. Describe the process of gaseous exchange in the alveoli. Your answer should include: [5]
- the structural features of the alveoli that make them efficient for gaseous exchange
- the role of the oxygen-haemoglobin dissociation curve
- how carbon dioxide is transported in the blood
15. Explain how the body responds to a decrease in blood glucose concentration after prolonged fasting. Include in your answer: [4]
- the role of the pancreas
- the hormonal response
- the metabolic processes involved in restoring blood glucose levels
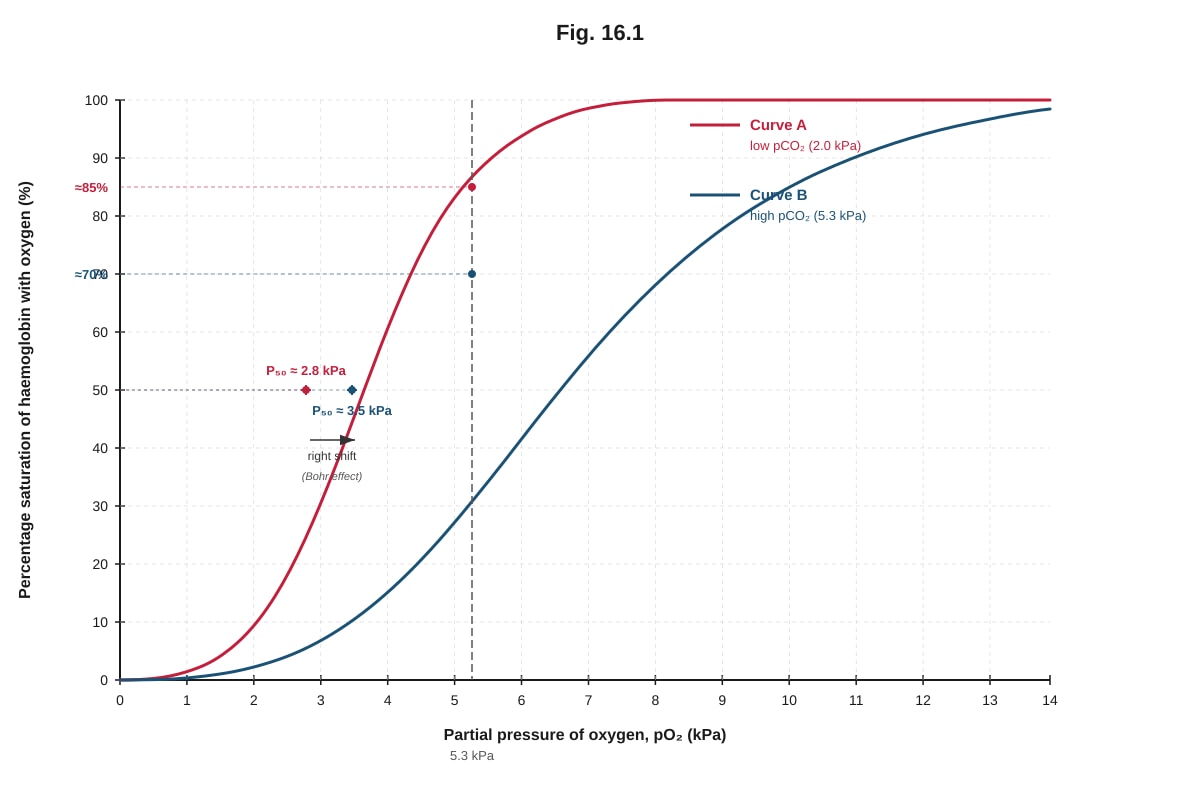
16. Fig. 16.1 shows the oxygen-haemoglobin dissociation curve for adult haemoglobin at two different partial pressures of carbon dioxide (pCO2).
Generated graph for Q16.
(a) With reference to Fig. 16.1, state the percentage saturation of haemoglobin at a pO2 of 5.3 kPa for both curves A and B. [1]
Curve A: _______________ % Curve B: _______________ %
(b) Explain the significance of the difference between curves A and B for oxygen delivery to respiring tissues. [3]
(c) State the name given to the shift shown by curve B and explain its physiological advantage. [2]
17. Compare and contrast the humoral and cell-mediated immune responses. Your answer should include: [4]
- the types of lymphocytes involved
- the targets of each response
- the mechanisms by which pathogens are destroyed
Section C: Data Interpretation and Application (15 marks)
Questions 18–20
18. A study was conducted to investigate the effect of altitude on the oxygen-carrying capacity of blood. Blood samples were taken from individuals living at sea level and at high altitude (4500 m). The results are shown in Table 18.1.
Table 18.1
| Parameter | Sea level | High altitude (4500 m) |
|---|---|---|
| pO2 in alveoli / kPa | 13.3 | 6.7 |
| Haemoglobin concentration / g per 100 cm³ blood | 15.0 | 20.0 |
| Percentage saturation of haemoglobin / % | 98 | 89 |
| Oxygen content of blood / cm³ O₂ per 100 cm³ blood | 19.7 | 23.9 |
(a) Using the data in Table 18.1, explain why individuals at high altitude have a higher haemoglobin concentration than those at sea level. [3]
(b) Despite the lower percentage saturation of haemoglobin at high altitude, the oxygen content of blood is higher than at sea level. Explain this apparent paradox using the data provided. [2]
(c) Suggest one other physiological adaptation that occurs in people living at high altitude and explain how it aids survival. [2]
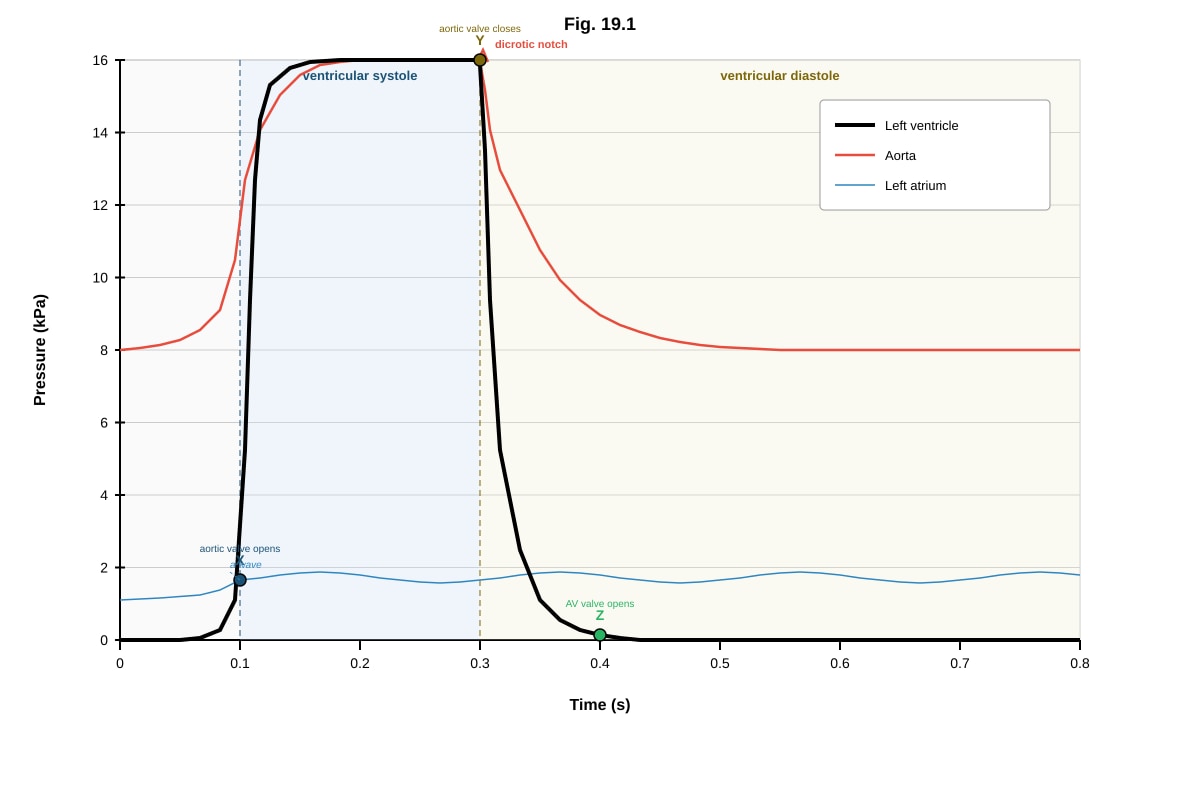
19. Fig. 19.1 shows the changes in pressure in the left ventricle, left aorta, and left atrium during one cardiac cycle.
Generated graph for Q19.
(a) With reference to Fig. 19.1, explain what causes the aortic valve to open at point X. [2]
(b) Explain the significance of the dicrotic notch (point Y) in the aortic pressure trace. [2]
(c) Describe the events occurring in the cardiac cycle between points Y and Z. [3]
(d) State the duration of one complete cardiac cycle as shown in Fig. 19.1 and calculate the heart rate in beats per minute. [2]
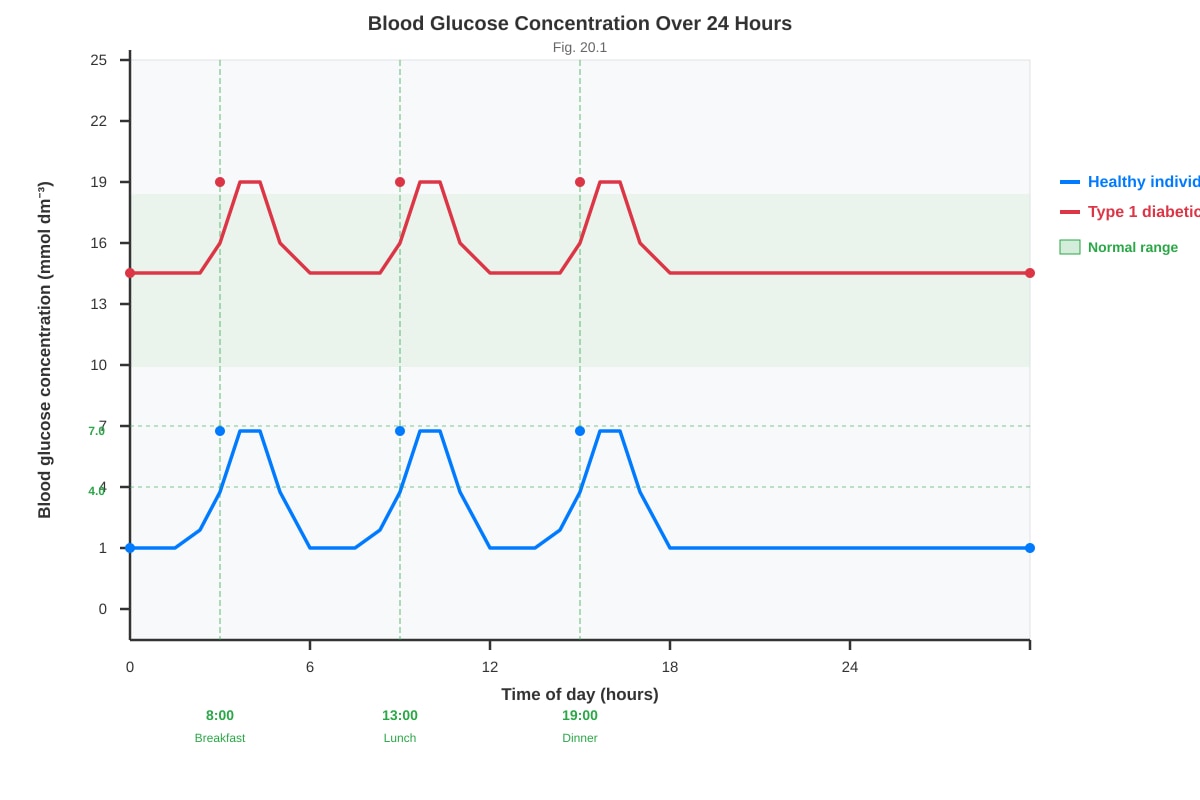
20. A patient with Type 1 diabetes mellitus is unable to produce insulin. Fig. 20.1 shows the changes in blood glucose concentration over 24 hours for a healthy individual and a patient with untreated Type 1 diabetes.
Generated graph for Q20.
(a) With reference to Fig. 20.1, compare the blood glucose profiles of the healthy individual and the patient with Type 1 diabetes. [3]
(b) Explain why the blood glucose concentration in the patient with Type 1 diabetes remains elevated and does not return to the normal range. [3]
(c) Suggest two complications that may arise from prolonged high blood glucose concentration in untreated Type 1 diabetes. [2]
END OF QUIZ
Answers
A-Level Biology H2 Quiz - Human Physiology
Answer Key
Section A: Short Answer Questions
1. [2 marks]
Two structural features of a motor neurone adapted for transmitting nerve impulses over long distances:
- Long axon — allows the nerve impulse to be conducted over long distances from the central nervous system to effector organs (e.g., muscles) without interruption.
- Myelin sheath — formed by Schwann cells, it insulates the axon and enables saltatory conduction, where the action potential jumps between nodes of Ranvier, greatly increasing the speed of impulse transmission.
Marking: 1 mark each, any two valid features. Accept: presence of nodes of Ranvier, many mitochondria in axon terminals for ATP production, or large cell body for metabolic support.
2. [2 marks]
| Feature | Hormone | Neurotransmitter |
|---|---|---|
| Mode of transport | Transported in the blood (circulatory system) | Diffuses across the synaptic cleft (extracellular fluid) |
| Speed of action | Slower onset, longer-lasting effect | Very rapid onset, short-lived effect |
Marking: 1 mark for correct mode of transport comparison, 1 mark for correct speed of action comparison. Both must be present for full marks.
3. [2 marks]
- Type of feedback: Negative feedback.
- Explanation: Negative feedback is important in homeostasis because it reverses a change from the set point (norm), restoring blood glucose concentration to its normal range (~4.0–7.0 mmol dm⁻³). When blood glucose rises after a meal, insulin is secreted to lower it; when it falls, glucagon is secreted to raise it. This self-regulating mechanism maintains a stable internal environment.
Marking: 1 mark for naming negative feedback, 1 mark for explaining its role in reversing deviation from the set point / maintaining homeostasis.
4. [4 marks total]
(a) [2 marks]
- Membrane potential at point B: −55 mV (threshold potential).
- Explanation: At this point, voltage-gated sodium (Na⁺) channels begin to open in response to a stimulus that has depolarised the membrane to threshold. Na⁺ ions begin to flow into the neurone down their electrochemical gradient, initiating the depolarisation phase of the action potential. Once threshold is reached, the action potential becomes self-propagating (all-or-none response).
Marking: 1 mark for stating −55 mV (threshold), 1 mark for explaining that voltage-gated Na⁺ channels open / Na⁺ influx begins.
(b) [2 marks]
Between points C and D, the membrane potential decreases (repolarisation) because:
- Voltage-gated Na⁺ channels become inactivated (close and enter a refractory state), stopping further Na⁺ influx.
- Voltage-gated potassium (K⁺) channels open, allowing K⁺ ions to flow out of the neurone down their concentration gradient.
- The efflux of positively charged K⁺ ions causes the membrane potential to return towards the resting potential.
Marking: 1 mark for Na⁺ channel inactivation, 1 mark for K⁺ channels opening and K⁺ efflux causing repolarisation.
5. [2 marks]
Two roles of aldosterone:
- Increases reabsorption of sodium ions (Na⁺) from the filtrate in the distal convoluted tubule and collecting duct back into the blood, which increases osmotic retention of water, thereby increasing blood volume and blood pressure.
- Increases secretion of potassium ions (K⁺) from the blood into the filtrate for excretion, helping to regulate blood K⁺ concentration and maintain electrolyte balance.
Marking: 1 mark each. Must link Na⁺ reabsorption to water retention / blood pressure for first mark.
6. [2 marks]
- Partial pressure is the pressure exerted by a single gas in a mixture of gases. It is proportional to the concentration (mole fraction) of that gas in the mixture.
- The pO2 in the alveoli (~13.3 kPa) is higher than the pO2 in the deoxygenated blood arriving at the lungs (~5.3 kPa). This concentration gradient drives the diffusion of oxygen from the alveolar air into the red blood cells, where oxygen binds to haemoglobin to form oxyhaemoglobin.
Marking: 1 mark for correct definition of partial pressure, 1 mark for explaining the diffusion gradient from alveoli to blood.
7. [2 marks]
The sinoatrial node (SAN), located in the wall of the right atrium, acts as the pacemaker of the heart. It generates rhythmic electrical impulses (action potentials) spontaneously and at regular intervals without nervous stimulation (myogenic). These impulses spread through the walls of both atria, causing atrial systole (contraction), and then reach the atrioventricular node (AVN), which relays the impulse to the ventricles via the Bundle of His and Purkinje fibres, coordinating the sequential contraction of atria then ventricles.
Marking: 1 mark for identifying SAN as the pacemaker / generating rhythmic impulses, 1 mark for describing spread of impulses causing atrial contraction / coordinating the cardiac cycle.
8. [2 marks]
- Cells responsible: Parietal cells (also called oxyntic cells) in the gastric glands of the stomach lining secrete hydrochloric acid (HCl).
- Protection from autodigestion: The stomach lining is protected by a thick layer of mucus secreted by goblet cells (mucous neck cells). This mucus forms a physical barrier that prevents HCl and the enzyme pepsin from contacting the epithelial cells. Additionally, the epithelial cells secrete bicarbonate ions (HCO₃⁻) into the mucus layer, which neutralises any acid that penetrates the mucus. The epithelial cells are also rapidly replaced (every 3–5 days) to repair any damage.
Marking: 1 mark for naming parietal cells, 1 mark for describing mucus layer and/or bicarbonate secretion as protection.
9. [2 marks]
Two adaptations of a villus for efficient absorption:
- Large surface area: Villi are finger-like projections that greatly increase the surface area of the small intestine, increasing the rate of absorption of nutrients. Each villus also has microvilli (brush border) on the epithelial cells, further increasing surface area.
- Rich blood supply / lacteal: Each villus contains a network of capillaries that absorb amino acids, monosaccharides, and water-soluble vitamins, and a lacteal (lymphatic vessel) that absorbs fatty acids and glycerol. The close proximity of these transport structures to the epithelium minimises the diffusion distance.
- Thin epithelium: The villus wall is only one cell thick (single layer of epithelial cells), providing a short diffusion pathway for nutrients to enter the blood or lymph.
Marking: 1 mark each, any two valid adaptations. Must link structure to function for each mark.
10. [2 marks]
(a) B lymphocytes: Upon activation by antigens (often with help from T helper cells), B lymphocytes differentiate into plasma cells that secrete antibodies (immunoglobulins). Antibodies bind specifically to antigens on pathogens, neutralising them or marking them for destruction by phagocytes (opsonisation). Some B cells become memory cells for long-term immunity.
(b) T helper cells: T helper cells (CD4⁺ T cells) release cytokines (chemical signals) that activate B lymphocytes to proliferate and differentiate into plasma cells, stimulate cytotoxic T cells to destroy infected cells, and enhance the activity of phagocytes. They play a central role in coordinating the adaptive immune response.
Marking: 1 mark each. B cells: must mention antibody production / plasma cells. T helper cells: must mention cytokine release / activation of other immune cells.
Section B: Structured Questions
11. [12 marks total]
(a) [3 marks]
- LH: LH levels are relatively low during most of the menstrual cycle. There is a sharp, transient surge in LH concentration at around day 14, which triggers ovulation. After the surge, LH levels fall sharply and remain low during the luteal phase.
- Progesterone: Progesterone levels are very low during the follicular phase (days 1–13). After ovulation (day 14), progesterone levels rise sharply, reaching a peak around day 21. They then decline towards the end of the cycle if fertilisation does not occur.
Marking: 1 mark for describing LH surge at day 14, 1 mark for describing low progesterone in follicular phase then rise after ovulation, 1 mark for stating progesterone peaks around day 21 / declines at end of cycle.
(b) [2 marks]
The LH surge triggers ovulation — the release of a mature secondary oocyte from the ovary. The high concentration of LH stimulates the completion of meiosis I in the primary oocyte, causes the Graafian follicle to rupture, and releases the oocyte into the oviduct. The remaining follicle cells then develop into the corpus luteum.
Marking: 1 mark for identifying ovulation, 1 mark for explaining that LH causes follicle rupture / oocyte release.
(c) [2 marks]
The rising levels of progesterone after day 14 exert negative feedback on the anterior pituitary gland (and hypothalamus), inhibiting the secretion of FSH and LH. This prevents the development of new follicles during the luteal phase and ensures that no further ovulation occurs during the same cycle. Progesterone acts on the hypothalamus to reduce GnRH release, which in turn reduces FSH and LH secretion from the anterior pituitary.
Marking: 1 mark for stating negative feedback on pituitary / hypothalamus, 1 mark for explaining inhibition of FSH and LH / prevention of further ovulation.
(d) [3 marks]
Synthetic progesterone in the contraceptive pill:
- Maintains a persistently high level of progesterone in the blood, mimicking the luteal phase.
- This exerts negative feedback on the hypothalamus and anterior pituitary, suppressing the secretion of FSH and LH.
- Without FSH, follicular development is inhibited (no mature follicle forms).
- Without the LH surge, ovulation does not occur, so no oocyte is released for fertilisation.
- Additionally, synthetic progesterone causes the cervical mucus to thicken, making it difficult for sperm to reach the uterus, and may alter the endometrium to make it less receptive to implantation.
Marking: 1 mark for negative feedback on pituitary/hypothalamus, 1 mark for suppression of FSH/LH preventing ovulation, 1 mark for additional mechanism (thickened cervical mucus / endometrial changes).
12. [10 marks total]
(a) [1 mark]
Cardiac output is the total volume of blood pumped out of the heart (from the left ventricle into the aorta) per unit time (per minute).
Marking: 1 mark for correct definition. Must include volume of blood per minute.
(b) [2 marks]
Cardiac output = Heart rate × Stroke volume
- At rest: 72 beats min⁻¹ × 70 cm³ = 5040 cm³ min⁻¹ (or 5.04 dm³ min⁻¹)
- During exercise: 145 beats min⁻¹ × 110 cm³ = 15 950 cm³ min⁻¹ (or 15.95 dm³ min⁻¹)
Marking: 1 mark for correct calculation at rest, 1 mark for correct calculation during exercise. Accept correct answers in cm³ min⁻¹ or dm³ min⁻¹. Unit required for full marks.
(c) [2 marks]
The increase in cardiac output during exercise delivers a greater volume of oxygenated blood per minute to the skeletal muscles. This is necessary because respiring muscle cells require more oxygen for aerobic respiration to produce more ATP to fuel muscle contraction. The increased blood flow also removes carbon dioxide and other metabolic waste products more rapidly.
Marking: 1 mark for linking increased cardiac output to increased oxygen delivery, 1 mark for linking to increased ATP demand / aerobic respiration in muscles.
(d) [3 marks]
The sympathetic nervous system is activated during exercise (and in anticipation of exercise via higher brain centres):
- Sympathetic nerves release noradrenaline at the sinoatrial node (SAN), which binds to β₁-adrenergic receptors on the pacemaker cells, increasing the rate of depolarisation and thus increasing heart rate (positive chronotropic effect).
- Sympathetic stimulation also increases the force of ventricular contraction (positive inotropic effect) by increasing Ca²⁺ influx into cardiac muscle cells, which increases stroke volume.
- The combined effect of increased heart rate and increased stroke volume results in a significantly increased cardiac output, ensuring adequate blood supply to active muscles.
Marking: 1 mark for noradrenaline acting on SAN to increase heart rate, 1 mark for increased force of contraction / stroke volume, 1 mark for overall increase in cardiac output.
13. [9 marks total]
(a) [3 marks]
Ultrafiltration in the Bowman's capsule occurs as follows:
- Blood enters the glomerulus via the afferent arteriole, which has a wider diameter than the efferent arteriole. This creates a high hydrostatic pressure in the glomerular capillaries.
- The high hydrostatic pressure forces small molecules (water, glucose, amino acids, ions, urea) out of the blood, through the fenestrated endothelium of the glomerular capillaries, through the basement membrane (which acts as a filter), and into the Bowman's capsule as glomerular filtrate.
- Large molecules such as proteins and blood cells are too large to pass through the basement membrane and remain in the blood, which flows out via the efferent arteriole.
Marking: 1 mark for afferent arteriole wider than efferent creating high pressure, 1 mark for small molecules forced out / filtration through capillary wall and basement membrane, 1 mark for large molecules (proteins/blood cells) retained in blood.
(b) [4 marks]
The loop of Henle creates a concentration gradient in the medulla of the kidney through a countercurrent multiplier system:
- The descending limb is permeable to water but relatively impermeable to solutes (Na⁺, Cl⁻). As the filtrate descends into the increasingly hypertonic medulla, water moves out by osmosis, concentrating the filtrate.
- The ascending limb is impermeable to water but actively transports Na⁺ and Cl⁻ out of the filtrate into the medullary interstitial fluid (via Na⁺/K⁺/2Cl⁻ cotransporters in the thick ascending limb). This makes the medulla increasingly hypertonic.
- The collecting duct passes through the hypertonic medulla. Under the influence of ADH (antidiuretic hormone), the collecting duct becomes permeable to water, and water moves out by osmosis into the medulla, producing concentrated urine.
- The vasa recta (capillaries) act as a countercurrent exchanger, maintaining the medullary concentration gradient without washing it out.
Marking: 1 mark for descending limb permeable to water / water exits, 1 mark for ascending limb actively transports Na⁺ and Cl⁻ out, 1 mark for creation of hypertonic medullary gradient, 1 mark for collecting duct permeability under ADH producing concentrated urine.
(c) [2 marks]
- Substance: Glucose (also accept amino acids).
- Mechanism: Glucose is completely reabsorbed in the proximal convoluted tubule by active transport (secondary active transport). On the apical (luminal) membrane of the epithelial cells, Na⁺-glucose cotransporters (SGLT) use the Na⁺ concentration gradient (maintained by Na⁺/K⁺ ATPase on the basolateral membrane) to transport glucose against its concentration gradient into the cell. Glucose then diffuses out of the cell into the blood capillaries via facilitated diffusion through GLUT transporters on the basolateral membrane.
Marking: 1 mark for naming glucose (or amino acids), 1 mark for describing active transport / cotransport with Na⁺.
14. [5 marks]
Structural features of alveoli:
- The alveoli have a large total surface area (approximately 70 m²) due to the presence of millions of alveoli, providing a large area for gaseous exchange.
- The alveolar wall is extremely thin (one cell thick, squamous epithelium), providing a short diffusion pathway for gases.
- The alveoli are surrounded by a dense network of capillaries, maintaining a steep concentration gradient of gases as blood is constantly flowing.
- The alveolar surface is kept moist by surfactant, allowing gases to dissolve before diffusing across the membrane.
Oxygen-haemoglobin dissociation curve:
- In the alveoli, where pO2 is high (~13.3 kPa), haemoglobin has a high affinity for oxygen and becomes almost fully saturated (~98%), forming oxyhaemoglobin (Hb + O₂ → HbO₂). The sigmoid shape of the curve means that at high pO2, haemoglobin loads oxygen efficiently.
Carbon dioxide transport:
- Carbon dioxide is transported in the blood in three ways:
- Dissolved in plasma (~7%): CO₂ dissolves directly in the blood plasma.
- As hydrogencarbonate ions (HCO₃⁻) (~70%): Inside red blood cells, CO₂ reacts with water to form carbonic acid (H₂CO₃), catalysed by the enzyme carbonic anhydrase. Carbonic acid dissociates into H⁺ and HCO₃⁻. HCO₃⁻ is transported out of the red blood cell into the plasma via a chloride shift (Cl⁻ moves in).
- As carbaminohaemoglobin (~23%): CO₂ binds directly to the amino groups of haemoglobin, forming carbaminohaemoglobin (Hb-CO₂).
Marking: 1 mark for structural features (any two valid points), 1 mark for dissociation curve explanation, 1 mark for CO₂ transport (at least two methods). Remaining 2 marks distributed across quality and detail of explanation.
15. [4 marks]
Role of the pancreas:
- The alpha (α) cells of the Islets of Langerhans in the pancreas detect the decrease in blood glucose concentration and secrete the hormone glucagon.
Hormonal response:
- Glucagon is released into the blood and acts primarily on hepatocytes (liver cells).
- Glucagon binds to specific receptors on hepatocyte cell membranes, activating a second messenger cascade (cAMP pathway), which activates enzymes involved in glycogenolysis and gluconeogenesis.
Metabolic processes:
- Glycogenolysis: Glucagon stimulates the breakdown of glycogen (stored in the liver) into glucose, which is released into the blood, raising blood glucose concentration.
- Gluconeogenesis: Glucagon promotes the synthesis of glucose from non-carbohydrate sources, such as amino acids, glycerol, and lactate, in the liver.
- Once blood glucose returns to normal, the stimulus for glucagon secretion is removed (negative feedback), and insulin secretion may increase to prevent hyperglycaemia.
Marking: 1 mark for alpha cells / glucagon secretion, 1 mark for glucagon acting on liver, 1 mark for glycogenolysis, 1 mark for gluconeogenesis.
16. [6 marks total]
(a) [1 mark]
- Curve A (low pCO2): approximately 85% saturation
- Curve B (high pCO2): approximately 70% saturation
Marking: ½ mark each. Accept values within ±5% of stated values based on reading from the graph.
(b) [3 marks]
The difference between curves A and B demonstrates the Bohr effect:
- At higher pCO2 (as found in actively respiring tissues), the dissociation curve shifts to the right, meaning haemoglobin has a lower affinity for oxygen.
- This is physiologically significant because in respiring tissues, CO₂ production is high, which lowers the pH (increases H⁺ concentration) and increases pCO2. The rightward shift causes haemoglobin to release oxygen more readily at these tissues, ensuring that oxygen is delivered where it is most needed.
- At the lungs, where pCO2 is low, the curve shifts to the left, increasing haemoglobin's affinity for oxygen and promoting efficient loading/oxygenation of haemoglobin.
Marking: 1 mark for identifying the Bohr effect / rightward shift, 1 mark for explaining lower O₂ affinity at high CO₂, 1 mark for linking to oxygen delivery at respiring tissues.
(c) [2 marks]
- Name: The Bohr shift (or Bohr effect).
- Physiological advantage: The Bohr shift ensures that haemoglobin unloads oxygen preferentially in tissues with high metabolic activity (high CO₂, low pH). This matches oxygen delivery to oxygen demand — tissues that are respiring rapidly and producing more CO₂ receive more oxygen, optimising aerobic respiration and ATP production.
Marking: 1 mark for naming the Bohr shift, 1 mark for explaining the advantage of matching O₂ delivery to metabolic demand.
17. [4 marks]
| Feature | Humoral Immune Response | Cell-Mediated Immune Response |
|---|---|---|
| Lymphocytes involved | B lymphocytes (B cells) | T lymphocytes (cytotoxic T cells, CD8⁺) |
| Targets | Extracellular pathogens (bacteria, viruses in blood/lymph, free antigens) | Intracellular pathogens (virus-infected cells, cancer cells, transplanted cells) |
| Mechanism of destruction | B cells differentiate into plasma cells that secrete antibodies. Antibodies bind to antigens, causing neutralisation, agglutination, or opsonisation (marking for phagocytosis). The complement system may also be activated, leading to lysis of pathogens. | Cytotoxic T cells recognise antigens presented on MHC class I molecules on the surface of infected/abnormal cells. They release perforin (creates pores in the target cell membrane) and granzymes (trigger apoptosis), destroying the infected cell. |
Marking: 1 mark for correct lymphocytes, 1 mark for correct targets, 1 mark for correct mechanisms, 1 mark for clear comparison structure. Answers may be in table or paragraph form.
Section C: Data Interpretation and Application
18. [7 marks total]
(a) [3 marks]
At high altitude, the partial pressure of oxygen in the alveoli is lower (6.7 kPa vs 13.3 kPa at sea level) because the atmospheric pressure is reduced. This means less oxygen diffuses into the blood, resulting in lower haemoglobin saturation (89% vs 98%). The reduced oxygen availability is detected by the kidneys, which respond by secreting the hormone erythropoietin (EPO). EPO stimulates the bone marrow to produce more red blood cells, increasing the haemoglobin concentration (20.0 g per 100 cm³ vs 15.0 g). This is a compensatory adaptation to increase the oxygen-carrying capacity of the blood despite the lower pO2.
Marking: 1 mark for lower pO₂ at altitude reducing O₂ availability, 1 mark for EPO secretion by kidneys, 1 mark for increased RBC production / haemoglobin concentration as compensation.
(b) [2 marks]
Although the percentage saturation is lower at high altitude (89% vs 98%), the haemoglobin concentration is significantly higher (20.0 g vs 15.0 g per 100 cm³ blood). The oxygen content depends on both the amount of haemoglobin and its saturation. The increased haemoglobin more than compensates for the reduced saturation:
- Sea level: 15.0 g × 0.98 = 14.7 g saturated Hb per 100 cm³ → 19.7 cm³ O₂ per 100 cm³
- High altitude: 20.0 g × 0.89 = 17.8 g saturated Hb per 100 cm³ → 23.9 cm³ O₂ per 100 cm³
Thus, the higher haemoglobin concentration results in a greater total oxygen content.
Marking: 1 mark for identifying that higher Hb concentration compensates for lower saturation, 1 mark for using data to support the explanation.
(c) [2 marks]
Adaptation: Increased ventilation rate (breathing rate).
Explanation: At high altitude, the lower pO2 is detected by chemoreceptors in the carotid bodies and aortic bodies. These send impulses to the respiratory centre in the medulla oblongata, which increases the rate and depth of breathing. This brings more air (and therefore more oxygen) into the alveoli per unit time, helping to maintain an adequate oxygen diffusion gradient despite the lower atmospheric pO2.
Alternative acceptable answers: increased capillary density in tissues, increased myoglobin in muscles, increased 2,3-BPG (bisphosphoglycerate) in red blood cells causing a rightward shift of the dissociation curve.
Marking: 1 mark for stating a valid adaptation, 1 mark for explaining how it aids survival.
19. [9 marks total]
(a) [2 marks]
At point X, the pressure in the left ventricle exceeds the pressure in the aorta. This occurs because during ventricular systole, the left ventricle contracts, causing a rapid increase in ventricular pressure. When the ventricular pressure rises above the aortic pressure (~8 kPa), the aortic (semilunar) valve is forced open, and blood is ejected from the ventricle into the aorta.
Marking: 1 mark for ventricular pressure exceeding aortic pressure, 1 mark for aortic valve opening / blood ejection into aorta.
(b) [2 marks]
The dicrotic notch is a brief dip in the aortic pressure trace caused by the closure of the aortic (semilunar) valve at the end of ventricular systole. When the ventricle begins to relax (early diastole), blood in the aorta briefly flows back towards the ventricle, causing the elastic aortic wall to recoil and close the valve. This closure prevents backflow of blood from the aorta into the left ventricle and maintains aortic pressure during diastole, ensuring continuous blood flow to the body.
Marking: 1 mark for identifying closure of the aortic valve, 1 mark for preventing backflow / maintaining aortic pressure.
(c) [3 marks]
Between points Y and Z:
- At point Y, the aortic valve closes (end of ventricular systole), marking the beginning of ventricular diastole.
- The left ventricle relaxes, causing ventricular pressure to fall rapidly.
- During this period, both the aortic valve and the atrioventricular (bicuspid/mitral) valve are closed — this is the phase of isovolumetric relaxation, where the ventricular volume remains constant while pressure falls.
- Meanwhile, the left atrium is filling with blood from the pulmonary veins, so atrial pressure gradually rises.
- At point Z, the ventricular pressure falls below the atrial pressure, causing the atrioventricular (bicuspid) valve to open, and blood flows passively from the atrium into the ventricle (ventricular filling).
Marking: 1 mark for aortic valve closure / start of diastole, 1 mark for isovolumetric relaxation (both valves closed), 1 mark for AV valve opening at point Z / ventricular filling.
(d) [2 marks]
- Duration of one cardiac cycle: 0.8 seconds (from the x-axis of Fig. 19.1).
- Heart rate calculation:
Heart rate=0.8 s per beat60 s min−1=75 beats min−1
Marking: 1 mark for stating 0.8 s, 1 mark for correct calculation of 75 beats min⁻¹.
20. [8 marks total]
(a) [3 marks]
Comparison of blood glucose profiles:
- In the healthy individual, blood glucose rises after meals (to ~7.0 mmol dm⁻³) but returns to the normal fasting level (~4.5 mmol dm⁻³) within approximately 2 hours. The blood glucose remains within the normal range (4.0–7.0 mmol dm⁻³) throughout the 24-hour period.
- In the Type 1 diabetic, blood glucose is already elevated at fasting (~15 mmol dm⁻³, well above normal). After meals, it rises much higher (to ~25 mmol dm⁻³) and does not return to any normal level — it remains elevated throughout the 24-hour period.
- The diabetic's blood glucose fluctuates over a much wider range (12–25 mmol dm⁻³) compared to the healthy individual (4.0–7.0 mmol dm⁻³).
Marking: 1 mark for describing healthy profile (returns to normal after meals), 1 mark for describing diabetic profile (remains elevated, higher peaks), 1 mark for direct comparison of range/magnitude.
(b) [3 marks]
In Type 1 diabetes, the beta (β) cells of the Islets of Langerhans in the pancreas have been destroyed by an autoimmune response, so the patient cannot produce insulin. Without insulin:
- Glucose uptake by muscle and adipose tissue is severely reduced because insulin is required for the translocation of GLUT4 transporters to the cell surface.
- The liver cannot convert excess glucose to glycogen (glycogenesis) or fat, and instead continues to produce glucose via glycogenolysis and gluconeogenesis (as the normal insulin-mediated suppression of these processes is absent).
- As a result, glucose accumulates in the blood (hyperglycaemia) and cannot be removed efficiently, so blood glucose remains persistently elevated.
Marking: 1 mark for absence of insulin production (beta cells destroyed), 1 mark for reduced glucose uptake by cells, 1 mark for continued glucose production by liver / lack of glycogenesis.
(c) [2 marks]
Two complications of prolonged hyperglycaemia in untreated Type 1 diabetes:
-
Diabetic ketoacidosis (DKA): Without insulin, cells cannot use glucose for energy, so the body breaks down fats instead. This produces ketone bodies (acetoacetate, 3-hydroxybutyrate), which are acidic and lower blood pH, potentially leading to coma and death if untreated.
-
Cardiovascular disease / atherosclerosis: Chronically elevated blood glucose damages the endothelium of blood vessels, promoting the formation of atherosclerotic plaques, increasing the risk of heart attack, stroke, and peripheral vascular disease.
Other acceptable answers: diabetic nephropathy (kidney damage), diabetic neuropathy (nerve damage), diabetic retinopathy (eye damage), poor wound healing / increased infection risk.
Marking: 1 mark each for any two valid complications with brief explanation.
END OF ANSWER KEY
Free quiz and exam paper access
Enter your details to view this paper
Your access is remembered on this device.