From Real Exams Quiz
A Level H2 Biology Genetics Inheritance Quiz
Free A Level H2 Biology Genetics Inheritance quiz, LongCat Exam version, with questions, answers, and A Level-style practice for Singapore students.
These static practice materials are generated from the site's syllabus and paper-generation workflow, with source and model context shown so students and parents can evaluate the material before use.
Questions
A-Level Biology H2 Quiz - Genetics Inheritance
Name: ________________________
Class: ________________________
Date: ________________________
Score: ________ / 60
Duration: 60 minutes
Total Marks: 60
Instructions:
- Answer ALL questions in the spaces provided.
- The number of marks for each question or part question is shown in brackets [ ].
- You are advised to spend no more than 60 minutes on this quiz.
- Where a question requires an explanation or description, use precise biological terminology.
- For genetic crosses, show all working including parental genotypes, gametes, and offspring genotypes/phenotypes where applicable.
Section A: Multiple Choice Questions (10 marks)
Questions 1–10 are multiple choice questions. Choose the most appropriate answer for each question.
1. In a cross between two heterozygous individuals (AaBb × AaBb) for two independently assorting genes, what proportion of the offspring is expected to be homozygous recessive for both traits?
A. 1/16
B. 3/16
C. 9/16
D. 1/4
[1]
2. A gene has two alleles, A (dominant) and a (recessive). If a heterozygous individual (Aa) is crossed with a homozygous recessive individual (aa), what is the probability that the first two offspring will both show the dominant phenotype?
A. 0
B. 1/4
C. 1/2
D. 3/4
[1]
3. Which of the following best describes codominance?
A. One allele completely masks the expression of another allele in the heterozygous condition.
B. Both alleles are fully expressed in the heterozygous condition, resulting in a phenotype showing both traits simultaneously.
C. The heterozygous phenotype is intermediate between the two homozygous phenotypes.
D. A single gene affects multiple unrelated phenotypic traits.
[1]
4. In humans, the ABO blood group system is controlled by three alleles: IA, IB, and i. A man with blood group AB marries a woman with blood group O. Which blood group(s) are possible in their children?
A. A and B only
B. AB and O only
C. A, B, AB, and O
D. A and B only, in equal proportions
[1]
5. A dihybrid cross produces offspring in a phenotypic ratio of 9:3:3:1. What does this ratio indicate?
A. The two genes are linked on the same chromosome.
B. The two genes assort independently and show complete dominance.
C. One gene is epistatic to the other.
D. Both genes show incomplete dominance.
[1]
6. In Drosophila, the genes for body colour (B = grey, b = black) and wing length (V = long, v = vestigial) are located on the same chromosome. A test cross of a heterozygous individual (BbVv) with a homozygous recessive individual (bbvv) produced the following offspring:
| Phenotype | Number |
|---|---|
| Grey body, long wings | 42 |
| Black body, vestigial wings | 38 |
| Grey body, vestigial wings | 10 |
| Black body, long wings | 10 |
What is the approximate recombination frequency between the two genes?
A. 10%
B. 20%
C. 40%
D. 80%
[1]
7. Which of the following statements about sex-linked inheritance is correct?
A. X-linked recessive disorders are more common in females than in males.
B. A father can pass an X-linked allele to his son.
C. A carrier female for an X-linked recessive disorder has a 50% chance of passing the allele to her son.
D. Y-linked disorders can be passed from mother to daughter.
[1]
8. In a population in Hardy-Weinberg equilibrium, the frequency of the recessive allele (q) is 0.3. What is the frequency of heterozygous individuals in the population?
A. 0.09
B. 0.21
C. 0.42
D. 0.49
[1]
9. A mutation changes a DNA sequence from 5'-ATG CCA TGG-3' to 5'-ATG CCA TAG-3'. What type of mutation is this?
A. Silent mutation
B. Missense mutation
C. Nonsense mutation
D. Frameshift mutation
[1]
10. Which of the following is an example of polygenic inheritance?
A. Human ABO blood groups
B. Flower colour in snapdragons (incomplete dominance)
C. Human skin colour
D. Sickle cell anaemia
[1]
Section B: Structured Questions (30 marks)
Answer ALL questions in this section.
11. In a certain species of plant, flower colour is controlled by two genes, A and B. The biochemical pathway is as follows:
White precursor --(Enzyme A)--> Pink intermediate --(Enzyme B)--> Red pigment
Gene A produces enzyme A; gene B produces enzyme B. Both enzymes must be functional for red flowers to be produced. The recessive alleles (a and b) produce non-functional enzymes.
(a) What term describes the interaction between genes A and B in this pathway?
[1]
(b) Two plants with genotype AaBb are crossed. Complete the Punnett square below and state the phenotypic ratio of the offspring.
| AB | Ab | aB | ab | |
|---|---|---|---|---|
| AB | ||||
| Ab | ||||
| aB | ||||
| ab |
Phenotypic ratio: _________________________________
[3]
(c) Explain why a cross between AaBb × AaBb does not produce a 9:3:3:1 ratio.
[2]
12. Haemophilia A is an X-linked recessive disorder caused by a mutation in the F8 gene on the X chromosome. The allele for normal blood clotting is denoted XH and the allele for haemophilia is denoted Xh.
(a) Explain why haemophilia A is more common in males than in females.
[2]
(b) A woman who is a carrier for haemophilia (XHXh) marries a man with normal blood clotting (XHY). Using a genetic diagram, determine the probability that:
(i) their first child will have haemophilia;
(ii) their first daughter will be a carrier.
[4]
(c) The couple's first son has haemophilia. What is the probability that their next son will also have haemophilia? Explain your answer.
[2]
13. The following pedigree chart shows the inheritance of a rare genetic condition in a family.
Image pending generation: diagram for Q13.
(a) Using the pedigree above, determine whether the condition is autosomal or sex-linked. Explain your reasoning.
[2]
(b) Deduce whether the condition is dominant or recessive. Explain your reasoning with reference to specific individuals in the pedigree.
[2]
(c) If individual II-2 marries an unaffected male from the general population, what is the probability that their first child will be affected? Assume the condition is rare in the population.
[2]
14. In a population of butterflies, wing pattern is controlled by a single gene with two alleles: M (mottled) and m (plain). A sample of 500 butterflies was taken and the following genotypes were recorded:
| Genotype | Number |
|---|---|
| MM | 180 |
| Mm | 240 |
| mm | 80 |
(a) Calculate the frequency of allele M and allele m in this population. Show your working.
[3]
(b) Using the Hardy-Weinberg equation, calculate the expected number of heterozygous individuals if the population is in Hardy-Weinberg equilibrium.
[2]
(c) Suggest two conditions that must be met for a population to be in Hardy-Weinberg equilibrium.
[2]
15. Sickle cell anaemia is caused by a mutation in the HBB gene on chromosome 11. The mutation is a single nucleotide substitution (GAG → GTG) in the sixth codon of the β-globin gene, resulting in the amino acid valine being substituted for glutamic acid.
(a) Name the type of gene mutation responsible for sickle cell anaemia.
[1]
(b) Explain how this single amino acid substitution causes red blood cells to become sickle-shaped.
[3]
(c) Heterozygous individuals (Hb^A Hb^S) have sickle cell trait and show resistance to malaria. Explain the evolutionary significance of this observation.
[2]
Section C: Data Interpretation and Extended Response (20 marks)
Answer ALL questions in this section.
16. A student investigated the inheritance of two traits in pea plants: seed shape (R = round, r = wrinkled) and seed colour (Y = yellow, y = green). The student performed the following crosses and recorded the results:
Cross 1: Round yellow × Wrinkled green → All offspring round yellow
Cross 2: F1 offspring from Cross 1 × Wrinkled green (test cross)
The results of Cross 2 were:
| Phenotype | Observed Number |
|---|---|
| Round yellow | 45 |
| Wrinkled green | 47 |
| Round green | 5 |
| Wrinkled yellow | 3 |
| Total | 100 |
(a) Explain why the results of Cross 1 indicate that round and yellow are dominant traits.
[2]
(b) The observed ratio in Cross 2 deviates significantly from the expected 1:1:1:1 ratio for a standard test cross. Suggest an explanation for this deviation.
[2]
(c) Calculate the recombination frequency between the genes for seed shape and seed colour. Show your working.
[2]
(d) The student expected a 1:1:1:1 ratio but obtained a different result. Explain what the recombination frequency calculated in (c) tells us about the chromosomal location of these two genes.
[2]
17. The following data shows the incidence of a recessive genetic disorder in two isolated human populations over 10 generations.
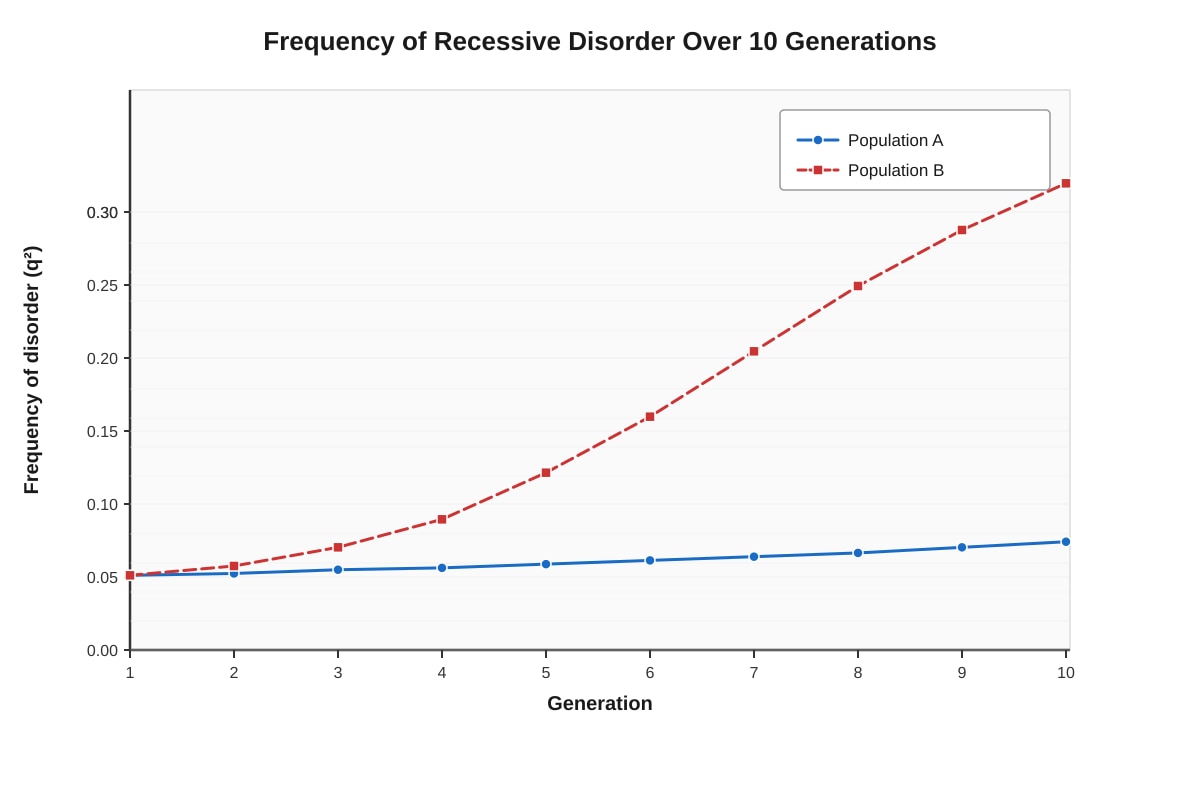
Generated graph for Q17.
(a) Describe the trend shown by Population A and Population B over the 10 generations.
[2]
(b) Suggest two possible reasons why Population B shows a much greater increase in the frequency of the disorder compared to Population A.
[2]
(c) Explain how genetic drift could lead to the observed pattern in Population B.
[2]
18. Cystic fibrosis (CF) is an autosomal recessive disorder caused by mutations in the CFTR gene on chromosome 7. The most common mutation is ΔF508, a deletion of three nucleotides that results in the loss of a phenylalanine residue at position 508 of the CFTR protein.
(a) Explain how the ΔF508 mutation affects the structure and function of the CFTR protein.
[3]
(b) In a population of 10,000 individuals, 400 are affected by cystic fibrosis. Calculate the frequency of carriers (heterozygotes) in this population. Show all working.
[3]
(c) A couple are both carriers of the ΔF508 mutation. They already have one child with cystic fibrosis. They are planning to have a second child. Explain why the probability that the second child will also have cystic fibrosis is still 1/4.
[2]
19. In a breeding experiment with mice, a scientist crossed pure-breeding black-furred mice with pure-breeding white-furred mice. All F1 offspring had grey fur. When the F1 offspring were interbred, the F2 generation showed the following phenotypic ratio:
Grey : Black : White = 9 : 3 : 4
(a) Name the type of gene interaction that produces this phenotypic ratio.
[1]
(b) Using suitable gene symbols, explain the genetic basis of this cross. Include the genotypes of the parental, F1, and F2 generations.
[4]
(c) Predict the phenotypic ratio if an F1 individual is test-crossed with a white-furred individual.
[2]
20. Read the following passage and answer the questions that follow.
The Human Genome Project (HGP), completed in 2003, identified approximately 20,000–25,000 protein-coding genes in the human genome. One of the key findings was that single nucleotide polymorphisms (SNPs) are the most common type of genetic variation among individuals. SNPs occur approximately once every 300 base pairs and can influence an individual's susceptibility to diseases, response to drugs, and other phenotypic traits. Genome-wide association studies (GWAS) use SNP data to identify genetic variants associated with complex diseases such as diabetes, heart disease, and cancer. However, most complex diseases are polygenic, meaning they are influenced by multiple genes, each with a small effect, as well as environmental factors.
(a) Define the term "single nucleotide polymorphism (SNP)" as used in the passage.
[1]
(b) Explain why GWAS are useful in studying complex diseases but may not identify all genetic factors involved.
[2]
(c) Using the concept of polygenic inheritance, explain why the inheritance pattern of complex diseases such as diabetes does not follow simple Mendelian ratios.
[2]
(d) Suggest one reason why understanding SNPs is important for personalised medicine.
[1]
END OF QUIZ
Answers
A-Level Biology H2 Quiz - Genetics Inheritance
Answer Key and Marking Scheme
Section A: Multiple Choice Questions (10 marks)
1. A [1]
In a dihybrid cross (AaBb × AaBb), the probability of being homozygous recessive for both traits (aabb) is 1/4 × 1/4 = 1/16. Each gene segregates independently, so the probability of aa is 1/4 and bb is 1/4; multiply for both together.
2. B [1]
A cross between Aa and aa produces offspring with genotypes Aa and aa in a 1:1 ratio. The probability of one offspring showing the dominant phenotype (Aa) is 1/2. For two offspring both to show the dominant phenotype: 1/2 × 1/2 = 1/4.
3. B [1]
Codominance occurs when both alleles in a heterozygote are fully and equally expressed, resulting in a phenotype that shows both traits simultaneously (e.g., AB blood group where both A and B antigens are expressed). Option A describes complete dominance; Option C describes incomplete dominance; Option D describes pleiotropy.
4. A [1]
The man has genotype IAIB and the woman has genotype ii. The possible gametes are IA and IB from the father, and i from the mother. Offspring genotypes: IAi (blood group A) and IBi (blood group B), in equal proportions. Blood groups AB and O are not possible.
5. B [1]
A 9:3:3:1 phenotypic ratio in a dihybrid cross is the classic result of two independently assorting genes, each showing complete dominance. This was first described by Gregor Mendel. Linked genes would produce a deviation from this ratio; epistasis would modify the ratio; incomplete dominance would produce different ratios.
6. B [1]
Recombination frequency = (number of recombinant offspring / total offspring) × 100. Recombinants are Grey body, vestigial wings (10) and Black body, long wings (10). Total = 100. RF = (10 + 10) / 100 × 100 = 20%.
7. C [1]
A carrier female (XHXh) produces 50% XH and 50% Xh gametes. Sons inherit the X chromosome from the mother, so there is a 50% chance a son inherits Xh and has haemophilia. Option A is incorrect because X-linked recessive disorders are more common in males. Option B is incorrect because fathers pass Y to sons, not X. Option D is incorrect because mothers do not have Y chromosomes.
8. C [1]
Given q = 0.3, then p = 1 − 0.3 = 0.7. Frequency of heterozygotes = 2pq = 2 × 0.7 × 0.3 = 0.42.
9. C [1]
The original codon TGG codes for tryptophan. The mutated codon TAG is a stop codon (amber). This is a nonsense mutation because it introduces a premature stop codon, resulting in a truncated protein. It is not a frameshift because only one nucleotide is substituted (not inserted or deleted).
10. C [1]
Human skin colour is controlled by multiple genes (estimated 3–6 genes), each contributing additively to the phenotype. This is a classic example of polygenic inheritance, resulting in a continuous range of phenotypes. ABO blood groups involve multiple alleles of a single gene; snapdragon flower colour shows incomplete dominance; sickle cell anaemia is a single-gene disorder.
Section B: Structured Questions (30 marks)
11.
(a) Epistasis [1]
Epistasis occurs when the expression of one gene affects (masks or modifies) the expression of another gene. Here, gene B can only produce red pigment if gene A has already produced the pink intermediate.
(b) [3]
Completed Punnett square:
| AB | Ab | aB | ab | |
|---|---|---|---|---|
| AB | AABB | AABb | AaBB | AaBb |
| Ab | AABb | AAbb | AaBb | Aabb |
| aB | AaBB | AaBb | aaBB | aaBb |
| ab | AaBb | Aabb | aaBb | aabb |
Phenotypic ratio: 9 Red : 3 Pink : 4 White [1 for correct ratio]
- Red (A_B_): 9/16 — both functional enzymes present
- Pink (A_bb): 3/16 — enzyme A functional, enzyme B non-functional
- White (aaB_ + aabb): 4/16 — enzyme A non-functional (no intermediate produced, so B cannot act)
[1 mark for correct Punnett square, 1 mark for correct phenotypic ratio, 1 mark for correct explanation of classes]
(c) [2]
The 9:3:3:1 ratio assumes independent gene interaction where each gene contributes independently to the phenotype. In this case, the genes interact in a biochemical pathway (epistasis). The presence of the recessive homozygous genotype (aa) masks the expression of gene B because no intermediate is produced for enzyme B to act upon. This modifies the expected ratio to 9:3:4 (recessive epistasis).
12.
(a) [2]
Males are hemizygous for X-linked genes (they have only one X chromosome). Therefore, a single recessive allele (Xh) on the X chromosome will express the disorder. Females have two X chromosomes and must inherit two copies of the recessive allele (XhXh) to be affected. A female with one copy (XHXh) is a carrier and phenotypically normal. This makes the disorder much more common in males.
(b) [4]
Genetic diagram:
| XH (from father) | Y (from father) | |
|---|---|---|
| XH (from mother) | XHXH (normal female) | XHY (normal male) |
| Xh (from mother) | XHXh (carrier female) | XhY (haemophiliac male) |
(i) Probability that first child will have haemophilia = 1/4 [1]
(Only XhY genotype out of 4 possible outcomes)
(ii) Probability that first daughter will be a carrier = 1/2 [1]
(Daughters are XHXH or XHXh; 1 out of 2 daughters is a carrier)
(c) [2]
The probability remains 1/4 [1]. Each fertilisation event is independent — the outcome of one pregnancy does not affect the next. The mother always produces 50% XH and 50% Xh gametes, and the father always produces 50% XH and 50% Y gametes. The previous son's genotype does not alter the probabilities for subsequent offspring [1].
13.
(a) [2]
The condition is autosomal [1]. If it were X-linked recessive, the affected male in Generation II would pass the allele to all his daughters (who would be carriers or affected). His daughter in Generation III is affected, which is consistent with autosomal inheritance. If it were X-linked dominant, the affected male would pass it to all daughters — which is observed — but the key evidence against X-linked is that an affected female in Generation III has an unaffected father (the affected male in Gen II married an unaffected female; their affected daughter could inherit the allele from her mother if autosomal recessive). The pattern is most consistent with autosomal recessive: unaffected parents (Gen I) produced an affected child (Gen II-1), indicating both parents were carriers.
(b) [2]
The condition is recessive [1]. The unaffected parents in Generation I produced an affected child (II-1). This is only possible if both parents were heterozygous carriers and the condition is recessive. If the condition were dominant, at least one parent would have to be affected to pass on the dominant allele [1].
(c) [2]
Individual II-2 is unaffected. Since her brother (II-1) is affected (aa), and her parents are both carriers (Aa), the possible genotypes for II-2 are: 1/3 AA or 2/3 Aa [1]. She marries an unaffected male from the general population. Assuming the condition is rare, the male is most likely AA. If II-2 is Aa (probability 2/3), the cross Aa × AA produces 0 affected offspring. If II-2 is AA (probability 1/3), all offspring are unaffected. Therefore, the probability that their first child will be affected is 0 (or effectively 0, assuming the population male is not a carrier) [1].
14.
(a) [3]
Total alleles in population = 500 × 2 = 1000
Number of M alleles = (180 × 2) + 240 = 360 + 240 = 600
Frequency of M (p) = 600/1000 = 0.6 [1]
Number of m alleles = (80 × 2) + 240 = 160 + 240 = 400
Frequency of m (q) = 400/1000 = 0.4 [1]
Check: p + q = 0.6 + 0.4 = 1.0 ✓ [1]
(b) [2]
Expected frequency of heterozygotes (2pq) = 2 × 0.6 × 0.4 = 0.48 [1]
Expected number of heterozygotes = 0.48 × 500 = 240 [1]
(c) [2]
Any two of the following (1 mark each, max 2):
- No mutation
- No natural selection (all genotypes have equal fitness)
- Random mating (no sexual selection)
- Large population size (no genetic drift)
- No gene flow (no migration into or out of the population)
15.
(a) Gene mutation / point mutation / substitution mutation [1]
(b) [3]
The substitution of valine (hydrophobic/non-polar) for glutamic acid (hydrophilic/negatively charged) at position 6 of the β-globin polypeptide [1] causes a hydrophobic patch to appear on the surface of the haemoglobin molecule [1]. Under low oxygen conditions, these hydrophobic patches cause haemoglobin molecules to aggregate and polymerise, forming long fibres that distort the red blood cell into a sickle shape [1].
(c) [2]
Heterozygous individuals have a selective advantage in malaria-endemic regions because the sickle cell trait (Hb^A Hb^S) provides partial resistance to Plasmodium falciparum infection [1]. This is an example of heterozygote advantage (balancing selection), where the Hb^S allele is maintained in the population despite being harmful in the homozygous state, because heterozygotes have higher fitness than either homozygote in malaria-affected areas [1].
Section C: Data Interpretation and Extended Response (20 marks)
16.
(a) [2]
In Cross 1, when pure-breeding round yellow is crossed with wrinkled green, all F1 offspring are round yellow [1]. This indicates that round is dominant over wrinkled, and yellow is dominant over green, because the recessive traits (wrinkled and green) are masked in the heterozygous F1 generation [1].
(b) [2]
The deviation from the expected 1:1:1:1 ratio indicates that the two genes are linked (located on the same chromosome) [1]. The parental phenotypes (round yellow and wrinkled green) appear in much higher numbers than the recombinant phenotypes (round green and wrinkled yellow), showing that the alleles tend to be inherited together rather than assorting independently [1].
(c) [2]
Recombination frequency = (recombinants / total) × 100
Recombinants = Round green (5) + Wrinkled yellow (3) = 8
Total = 100
RF = (8/100) × 100 = 8% [2]
(d) [2]
A recombination frequency of 8% indicates that the two genes are located on the same chromosome and are 8 map units (centimorgans) apart [1]. The low recombination frequency means the genes are closely linked and tend to be inherited together, which explains why the parental combinations are much more frequent than recombinant combinations [1].
17.
(a) [2]
Population A shows a gradual, slight increase in the frequency of the disorder over 10 generations, rising from approximately 0.04 to 0.06 [1]. Population B shows a dramatic increase in the frequency of the disorder, rising from approximately 0.04 to 0.25 over the same period [1].
(b) [2]
Any two of the following (1 mark each):
- Population B may have a smaller effective population size, making it more susceptible to genetic drift
- Population B may have experienced a founder effect, where the founding individuals happened to carry the recessive allele at higher frequency
- Population B may have experienced a population bottleneck, reducing genetic diversity and increasing allele frequency by chance
- Population B may have higher rates of consanguineous mating (inbreeding), increasing homozygosity
- Population B may have different selection pressures (e.g., heterozygote advantage)
(c) [2]
Genetic drift is the random change in allele frequencies due to chance events in small populations [1]. In Population B, the recessive allele frequency may have increased randomly over generations because the population is small, and chance events (such as certain individuals contributing more offspring to the next generation) caused the allele to become more common. This is especially pronounced in isolated populations with limited gene flow [1].
18.
(a) [3]
The ΔF508 mutation is a deletion of three nucleotides (CTT) from the CFTR gene, resulting in the loss of phenylalanine at position 508 of the protein [1]. This deletion occurs in the first nucleotide-binding domain (NBD1) of the CFTR protein, which is essential for ATP binding and channel gating [1]. The misfolded protein is recognised by the cell's quality control system (endoplasmic reticulum-associated degradation) and is degraded before it can reach the cell membrane, resulting in a lack of functional chloride channels at the cell surface [1].
(b) [3]
Given: 400 affected individuals out of 10,000
Frequency of affected (q²) = 400/10,000 = 0.04 [1]
q = √0.04 = 0.2
p = 1 − 0.2 = 0.8
Frequency of carriers (2pq) = 2 × 0.8 × 0.2 = 0.32 [1]
Number of carriers = 0.32 × 10,000 = 3,200 [1]
(c) [2]
Each conception is an independent event [1]. The parental genotypes do not change: both parents are carriers (Cc × Cc). The probability of each offspring inheriting two recessive alleles (cc) is always 1/4, regardless of the genotypes of previous children. The outcome of one pregnancy does not influence the outcome of the next [1].
19.
(a) Recessive epistasis [1]
(b) [4]
Let gene A control the production of grey pigment and gene B control the conversion of grey to black.
- Parental cross: AAbb (black) × aaBB (white) [1]
- F1 generation: AaBb (grey) — both genes functional, grey pigment produced and partially converted [1]
- F2 generation: A_B_ (9/16 grey), A_bb (3/16 black), aaB_ (3/16 white), aabb (1/16 white) [1]
The aa genotype is epistatic — when homozygous recessive (aa), it masks the expression of gene B, resulting in white fur regardless of the B allele. This gives the 9:3:4 ratio (9 grey : 3 black : 4 white) [1].
(c) [2]
F1 (AaBb) × white (aabb):
| AB | Ab | aB | ab | |
|---|---|---|---|---|
| ab | AaBb | Aabb | aaBb | aabb |
Offspring: 1 AaBb (grey) : 1 Aabb (black) : 1 aaBb (white) : 1 aabb (white)
Phenotypic ratio: 1 Grey : 1 Black : 2 White [2]
20.
(a) [1]
A single nucleotide polymorphism (SNP) is a variation in a single nucleotide (A, T, C, or G) at a specific position in the genome, that occurs in at least 1% of the population.
(b) [2]
GWAS are useful because they scan the entire genome for SNPs associated with diseases, allowing researchers to identify multiple genetic variants that contribute to complex diseases [1]. However, GWAS may miss rare variants (which are not well-tagged by common SNPs), gene-gene interactions (epistasis), gene-environment interactions, and structural variants (deletions, duplications) that are not captured by SNP arrays [1].
(c) [2]
Complex diseases like diabetes are polygenic, meaning they are influenced by multiple genes, each contributing a small effect to the overall phenotype [1]. Additionally, environmental factors (diet, exercise, lifestyle) interact with genetic predisposition. This multifactorial nature means the phenotype does not segregate into discrete categories as expected under simple Mendelian inheritance, and instead shows a continuous distribution of risk [1].
(d) [1]
Understanding SNPs allows for pharmacogenomics — tailoring drug treatments to an individual's genetic profile. For example, certain SNPs affect how individuals metabolise specific drugs, allowing doctors to prescribe the most effective drug and dosage for each patient, minimising adverse reactions and maximising therapeutic benefit.
END OF ANSWER KEY
Free quiz and exam paper access
Enter your details to view this paper
Your access is remembered on this device.