From Real Exams Quiz
A Level H2 Biology Ecology Quiz
Free A Level H2 Biology Ecology quiz, LongCat Exam version, with questions, answers, and A Level-style practice for Singapore students.
These static practice materials are generated from the site's syllabus and paper-generation workflow, with source and model context shown so students and parents can evaluate the material before use.
Questions
A-Level Biology H2 Quiz - Ecology
Name: ___________________________ Class: ___________________________ Date: ___________________________ Score: _____ / 40
Duration: 50 minutes Total Marks: 40
Instructions:
- Answer ALL questions in the spaces provided.
- Write in dark blue or black pen.
- You may use a pencil for any diagrams or graphs.
- The number of marks for each question is shown in brackets [ ].
- You are advised to spend no more than 50 minutes on this paper.
- Where a question requires a description or explanation, use precise biological terminology.
Section A: Multiple Choice Questions (10 marks)
Questions 1–10 are multiple choice. Each question is worth 1 mark. Write the letter corresponding to the correct answer in the space provided.
1. Which of the following best describes a community?
A) All the organisms of one species in a habitat at a given time B) All the organisms of all species in a habitat at a given time C) All the organisms and the abiotic factors in a habitat D) The role that an organism plays within an ecosystem
Answer: _____ [1]
2. A pyramid of numbers may be inverted when:
A) The producers are large and the primary consumers are small B) The producers are small and the primary consumers are large C) Energy transfer between trophic levels is very efficient D) The ecosystem has a very high productivity
Answer: _____ [1]
3. In the carbon cycle, carbon is returned to the atmosphere primarily through:
A) Photosynthesis only B) Respiration only C) Respiration and combustion D) Decomposition and nitrogen fixation
Answer: _____ [1]
4. A student used a quadrat of area 0.25 m² to estimate the population density of dandelions in a field. She placed the quadrat 10 times and counted the following numbers of dandelions: 3, 5, 2, 4, 6, 3, 4, 5, 3, 4. What is the estimated population density per m²?
A) 3.9 B) 15.6 C) 19.5 D) 39.0
Answer: _____ [1]
5. Which of the following is an example of primary succession?
A) Colonisation of plants on an abandoned farmland B) Regrowth of vegetation after a forest fire C) Colonisation of lichens on bare rock after a volcanic eruption D) Recovery of a meadow after a drought
Answer: _____ [1]
6. The mark-release-recapture method was used to estimate the population of squirrels in a woodland. On the first capture, 80 squirrels were caught, marked, and released. On the second capture, 60 squirrels were caught, of which 15 were marked. What is the estimated population size?
A) 155 B) 240 C) 320 D) 480
Answer: _____ [1]
7. Which statement about energy flow through an ecosystem is correct?
A) Energy is recycled through the ecosystem B) Approximately 90% of energy is transferred from one trophic level to the next C) Energy enters the ecosystem primarily as light energy and is lost as heat D) Decomposers return energy directly to producers
Answer: _____ [1]
8. In a food chain: grass → grasshopper → frog → snake → hawk, the frog is a:
A) Producer B) Primary consumer C) Secondary consumer D) Tertiary consumer
Answer: _____ [1]
9. Which of the following is a density-dependent factor affecting population size?
A) Earthquake B) Volcanic eruption C) Competition for food D) Tsunami
Answer: _____ [1]
10. The nitrogen cycle involves several groups of microorganisms. Which group converts atmospheric nitrogen (N2) into ammonia (NH3)?
A) Nitrifying bacteria B) Denitrifying bacteria C) Nitrogen-fixing bacteria D) Ammonifying bacteria
Answer: _____ [1]
Section B: Structured Questions (20 marks)
Answer ALL questions. Write your answers in the spaces provided.
11. Table 1 shows the population sizes of four species (A, B, C, and D) in a woodland ecosystem sampled over five years.
Table 1
| Year | Species A | Species B | Species C | Species D |
|---|---|---|---|---|
| 2019 | 120 | 80 | 200 | 50 |
| 2020 | 115 | 85 | 190 | 55 |
| 2021 | 105 | 95 | 175 | 65 |
| 2022 | 90 | 110 | 155 | 80 |
| 2023 | 75 | 125 | 130 | 100 |
(a) Calculate the percentage decrease in the population of Species A from 2019 to 2023. Show your working. [2]
(b) Describe the trend shown by Species B over the five-year period. [1]
(c) Species A and Species B are predator and prey respectively. Using the data in Table 1, explain how the population trends of Species A and Species B support this relationship. [3]
(d) Suggest one reason why the population of Species D might have increased over the same period. [1]
12. Fig. 12.1 shows a simplified food web in a freshwater ecosystem.
Image pending generation: diagram for Q12.
Fig. 12.1
(a) Name the trophic level occupied by the large fish. [1]
(b) Identify the organism(s) that occupy more than one trophic level. Explain your answer. [2]
(c) Explain what would happen to the population of herons if the large fish population decreased significantly. [2]
(d) Explain the role of decomposers in this ecosystem. [2]
13. An investigation was carried out to study the effect of light intensity on the distribution of two species of seaweed, Fucus and Chondrus, on a rocky shore. The percentage cover of each species was measured at different tidal heights. The results are shown in Fig. 13.1.
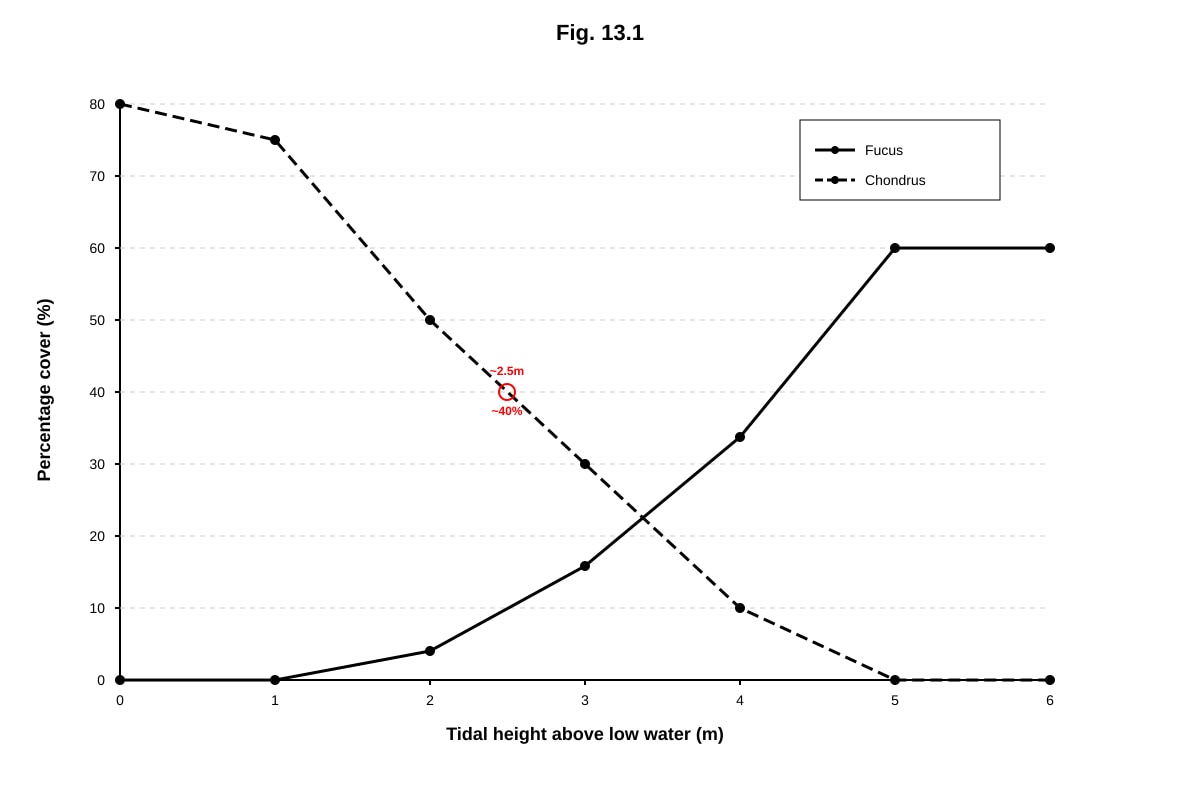
Generated graph for Q13.
Fig. 13.1
(a) Describe the distribution of Fucus with respect to tidal height. [2]
(b) Explain how competition may account for the distribution patterns of the two seaweed species. [3]
(c) Suggest one abiotic factor, other than light intensity, that could influence the distribution of these seaweeds on the rocky shore. [1]
14. (a) Describe the process of eutrophication in a freshwater ecosystem. [4]
(b) Explain how eutrophication can lead to a decrease in biodiversity in the affected ecosystem. [2]
Section C: Free Response (10 marks)
Answer ALL questions. Write your answers in the spaces provided.
15. Explain how energy flows through an ecosystem and why food chains rarely exceed four or five trophic levels. In your answer, include reference to the roles of producers, consumers, and decomposers. [5]
16. A tropical rainforest is cleared for palm oil plantation. Discuss the effects of this deforestation on biodiversity, the carbon cycle, and the water cycle. [5]
17. Explain the roles of nitrogen-fixing bacteria, nitrifying bacteria, and denitrifying bacteria in the nitrogen cycle. [3]
18. Describe how you would use quadrats and the mark-release-recapture method to estimate the population size of a plant species and an animal species in a grassland ecosystem. [4]
19. Explain how succession leads to a climax community. Include in your answer the differences between primary and secondary succession. [3]
20. Explain how two named human activities have contributed to the enhanced greenhouse effect, and describe one biological consequence of global warming on ecosystems. [5]
End of Quiz
Answers
A-Level Biology H2 Quiz - Ecology: Answer Key
Section A: Multiple Choice Questions
1. Answer: B [1]
Explanation: A community is defined as all the organisms of all species living and interacting in a particular habitat at a given time. Option A describes a population. Option C describes an ecosystem (which includes abiotic factors). Option D describes an ecological niche. This is a fundamental distinction in ecology: population = one species; community = all species; ecosystem = community + abiotic environment.
2. Answer: B [1]
Explanation: A pyramid of numbers shows the number of organisms at each trophic level. It becomes inverted when a single large producer (e.g., one oak tree) supports many small primary consumers (e.g., thousands of aphids). Option A would produce a normal pyramid. Option C is incorrect because energy transfer is typically only ~10% efficient. Option D is unrelated to pyramid shape.
3. Answer: C [1]
Explanation: Carbon is returned to the atmosphere as carbon dioxide (CO2) through cellular respiration (by all living organisms) and combustion (burning of fossil fuels and biomass). Photosynthesis removes CO2 from the atmosphere. Decomposition releases carbon compounds but primarily into the soil; nitrogen fixation is part of the nitrogen cycle, not the carbon cycle.
4. Answer: B [1]
Working:
- Total dandelions counted = 3 + 5 + 2 + 4 + 6 + 3 + 4 + 5 + 3 + 4 = 39
- Mean count per quadrat = 39 ÷ 10 = 3.9 dandelions per 0.25 m²
- Population density per m² = 3.9 ÷ 0.25 = 15.6 dandelions/m²
Common mistake: Students may forget to divide by the quadrat area and select A (3.9), or they may multiply by 10 (number of throws) instead of dividing by 0.25, giving D (39.0).
5. Answer: C [1]
Explanation: Primary succession occurs on newly formed or exposed land where no soil previously existed, such as bare rock after a volcanic eruption. Lichens are typical pioneer species. Options A, B, and D all describe secondary succession, which occurs where soil is already present (after a disturbance that did not remove the soil).
6. Answer: C [1]
Working: Using the Lincoln-Petersen index for mark-release-recapture:
N=RM×C
Where:
- N = estimated total population
- M = number marked and released on first capture = 80
- C = total number captured on second capture = 60
- R = number of marked individuals recaptured = 15
N=1580×60=154800=320
Common mistake: Students may add the captures (80 + 60 − 15 = 125, close to option A) instead of using the formula correctly.
7. Answer: C [1]
Explanation: Energy enters ecosystems as light energy (captured by producers through photosynthesis) and is progressively lost as heat at each trophic level through respiration. Energy is NOT recycled — it flows in one direction (option A is false). Only about 10% of energy is transferred between trophic levels (option B is false). Decomposers break down dead matter and release nutrients, not energy, back to the ecosystem (option D is false).
8. Answer: C [1]
Explanation: In this food chain: grass (producer) → grasshopper (primary consumer) → frog (secondary consumer) → snake (tertiary consumer) → hawk (quaternary consumer). The frog feeds on the grasshopper (primary consumer), making it a secondary consumer. Students should count trophic levels starting from the producer as level 1.
9. Answer: C [1]
Explanation: Density-dependent factors are those whose effects on population size vary with population density. Competition for food intensifies as population density increases, making it density-dependent. Options A, B, and D are density-independent factors (natural disasters) that affect populations regardless of their density.
10. Answer: C [1]
Explanation: Nitrogen-fixing bacteria (e.g., Rhizobium in root nodules, Azotobacter free-living in soil) convert atmospheric N2 into ammonia (NH3) through nitrogen fixation. Nitrifying bacteria convert ammonia to nitrites and then nitrites to nitrates. Denitrifying bacteria convert nitrates back to N2. Ammonifying bacteria (decomposers) convert organic nitrogen to ammonia.
Section B: Structured Questions
11. (a) [2]
Working:
- Decrease = 120 − 75 = 45
- Percentage decrease = 12045×100 = 37.5%
Marking:
- [1] for correct working (120 − 75 = 45, then 45/120 × 100)
- [1] for correct answer (37.5%)
Common mistake: Using 75 as the denominator instead of 120. The percentage change is always calculated relative to the original value.
11. (b) [1]
Answer: The population of Species B increased steadily from 80 in 2019 to 125 in 2023.
Marking:
- [1] for describing an increase over the period (must reference the trend, not just state numbers)
11. (c) [3]
Answer:
- As the prey population (Species B) increased from 2019 to 2023, more food was available for the predator (Species A). [1]
- However, Species A initially declined, suggesting that the predator population may have initially been limited by other factors, or there is a time lag in the predator-prey relationship. [1]
- Alternatively, if Species A is the predator and Species B is the prey, the decline in Species A (predator) from 2019 onwards would reduce predation pressure on Species B (prey), allowing the prey population to increase. [1]
Note: The data shows Species A declining and Species B increasing. If A is the predator of B, this could be explained by: the predator population declining due to other factors (disease, emigration), which then reduces predation pressure, allowing the prey population to rise. Credit any logically consistent explanation that references the data and the predator-prey relationship.
Marking:
- [1] for correctly identifying the predator-prey relationship from the data
- [1] for explaining the inverse relationship between predator and prey populations
- [1] for linking the explanation to specific data from the table
11. (d) [1]
Answer: Species D may have increased due to reduced predation (as the predator Species A declined), or due to increased availability of food/resources, or reduced competition from other species.
Marking:
- [1] for any valid ecological reason
12. (a) [1]
Answer: Tertiary consumer (or third consumer level / fourth trophic level)
Explanation: The large fish feeds on small fish (secondary consumers) and water beetles (secondary consumers), placing it at the tertiary consumer level. Phytoplankton = producer (1st trophic level); zooplankton = primary consumer (2nd); small fish and water beetles = secondary consumers (3rd); large fish = tertiary consumer (4th); herons = quaternary consumer (5th).
12. (b) [2]
Answer: Small fish [1] occupy more than one trophic level because they feed on both phytoplankton (producers, making them primary consumers) and zooplankton (primary consumers, making them secondary consumers). [1]
Marking:
- [1] for identifying small fish
- [1] for explaining that they feed at two different trophic levels
Note: Water beetles also occupy more than one trophic level as they feed on zooplankton (primary consumer level) and detritus. Credit this alternative answer with valid explanation.
12. (c) [2]
Answer: If the large fish population decreased significantly, the heron population would also decrease [1] because herons depend on large fish as a food source, and with less food available, herons would experience increased mortality and/or reduced reproductive success. [1]
Marking:
- [1] for stating that the heron population would decrease
- [1] for explaining the reason (reduced food availability leading to population decline)
Note: Credit answers that also mention herons may switch to feeding more on small fish, but the overall energy available to herons would still decline.
12. (d) [2]
Answer: Decomposers break down dead organic matter (detritus) from all trophic levels [1], releasing inorganic nutrients (such as nitrogen and phosphorus compounds) back into the ecosystem, which can then be reused by producers. [1]
Marking:
- [1] for describing the breakdown of dead organic matter/detritus
- [1] for explaining the recycling of nutrients back to producers
Note: Decomposers are essential for nutrient cycling. Without them, nutrients would remain locked in dead organisms and waste, and producers would eventually run out of essential minerals.
13. (a) [2]
Answer: The percentage cover of Fucus is highest at high tidal heights (approximately 80% at 5 m) [1] and decreases steadily to near 0% at low tidal heights (0–1 m). [1]
Marking:
- [1] for describing the general trend (decreasing cover with decreasing tidal height / increasing cover with increasing tidal height)
- [1] for referencing specific data values from the graph
13. (b) [3]
Answer:
- Fucus and Chondrus compete for resources such as light, space, and nutrients on the rocky shore. [1]
- At high tidal heights, Fucus is the better competitor (possibly for light or space), so it dominates and excludes Chondrus. [1]
- At low tidal heights, Chondrus is the better competitor (possibly more tolerant of submersion or wave action), so it dominates and excludes Fucus. [1]
Marking:
- [1] for identifying competition as the mechanism
- [1] for explaining Fucus dominance at high tidal heights
- [1] for explaining Chondrus dominance at low tidal heights
Note: The key concept here is competitive exclusion — two species with similar ecological niches cannot coexist indefinitely in the same habitat. The crossover point at ~2.5 m represents the zone where neither species has a clear competitive advantage.
13. (c) [1]
Answer: Wave action / exposure to air (desiccation) / temperature / salinity
Marking:
- [1] for any valid abiotic factor relevant to rocky shore ecology
14. (a) [4]
Answer:
- Eutrophication begins when excess nutrients (particularly nitrates and phosphates from agricultural runoff or sewage) enter a freshwater ecosystem. [1]
- These nutrients stimulate rapid growth of algae, leading to algal blooms on the water surface. [1]
- The algal blooms block light from reaching submerged plants, causing them to die. [1]
- The dead algae and plants are decomposed by aerobic bacteria, which consume large amounts of dissolved oxygen, leading to hypoxia (oxygen depletion) and the death of aquatic organisms such as fish. [1]
Marking:
- [1] for nutrient input (nitrates/phosphates from runoff or sewage)
- [1] for algal bloom formation
- [1] for death of submerged plants due to reduced light
- [1] for bacterial decomposition consuming oxygen, leading to organism death
Note: This is a standard A-Level sequence. Students must describe the process in the correct causal order. Award marks for any four valid sequential points.
14. (b) [2]
Answer:
- The depletion of dissolved oxygen (hypoxia) kills aerobic organisms such as fish and invertebrates, reducing species diversity. [1]
- The loss of submerged plants removes habitats and food sources for other organisms, further reducing biodiversity. [1]
Marking:
- [1] for explaining oxygen depletion leading to death of aerobic organisms
- [1] for explaining loss of habitat/food sources reducing biodiversity
Section C: Free Response
15. [5]
Answer:
- Energy enters the ecosystem when producers (e.g., green plants, phytoplankton) convert light energy into chemical energy through photosynthesis, storing it in organic molecules such as glucose. [1]
- Primary consumers (herbivores) obtain energy by feeding on producers. Secondary consumers obtain energy by feeding on primary consumers, and so on up the food chain. [1]
- At each trophic level, a large proportion of energy (approximately 90%) is lost through respiration (as heat), excretion, and indigestible material (e.g., faeces). Only about 10% of the energy at one trophic level is incorporated into the biomass of the next level. [1]
- Decomposers break down dead organisms and waste materials at all trophic levels, releasing the remaining energy as heat through respiration and recycling nutrients back into the ecosystem. [1]
- Because energy is lost at each transfer, there is insufficient energy to sustain viable populations beyond four or five trophic levels. The total energy available at higher trophic levels is too small to support another level of consumers. [1]
Marking:
- [1] for energy entry via photosynthesis in producers
- [1] for energy transfer between trophic levels via feeding
- [1] for energy loss at each trophic level (~90% lost, ~10% transferred)
- [1] for role of decomposers
- [1] for explaining why food chains are limited to 4–5 levels (insufficient energy at higher levels)
16. [5]
Answer:
Effects on biodiversity:
- Deforestation destroys habitats, leading to the loss of many plant and animal species that depend on the rainforest ecosystem. [1]
- The reduction in habitat complexity and food sources causes a decline in species richness and species diversity. Specialist species are particularly vulnerable. [1]
Effects on the carbon cycle:
- Trees store large amounts of carbon in their biomass. When forests are cleared and burned, this carbon is released as CO2 into the atmosphere. [1]
- The removal of trees also reduces the rate of photosynthesis, decreasing the amount of CO2 absorbed from the atmosphere, leading to increased atmospheric CO2 concentrations. [1]
Effects on the water cycle:
- Trees play a key role in transpiration, which contributes to cloud formation and local rainfall. Deforestation reduces transpiration, potentially leading to reduced local precipitation. [1]
- Without tree roots to absorb water and stabilise soil, there is increased surface runoff, soil erosion, and risk of flooding. [1]
Marking:
- [1] for habitat loss leading to species decline
- [1] for further biodiversity detail (species richness, specialist species)
- [1] for carbon release through burning/clearing
- [1] for reduced CO₂ absorption due to loss of photosynthesis
- [1] for effects on water cycle (transpiration, runoff, erosion)
Note: Award a maximum of 5 marks. Students need not cover every sub-point above; credit any five valid points across the three areas.
17. [3]
Answer:
- Nitrogen-fixing bacteria (e.g., Rhizobium, Azotobacter) convert atmospheric nitrogen gas (N2) into ammonia (NH3), which can then be used by plants. [1]
- Nitrifying bacteria (e.g., Nitrosomonas and Nitrobacter) convert ammonia (NH3) into nitrites (NO2−) and then into nitrates (NO3−), which are the main form of nitrogen absorbed by plant roots. [1]
- Denitrifying bacteria (e.g., Pseudomonas) convert nitrates (NO3−) back into atmospheric nitrogen gas (N2), completing the cycle by returning nitrogen to the atmosphere. [1]
Marking:
- [1] for each correctly described role (3 marks total)
Note: Students must name the type of bacteria AND describe the correct conversion. Award partial credit (½ mark) if the bacteria are named but the conversion is incorrect, or vice versa, but the total for each sub-part is 1 mark.
18. [4]
Answer:
Using quadrats for a plant species:
- Place quadrats randomly within the grassland using random number coordinates or a random number generator to avoid bias. [1]
- Count the number of individuals of the plant species within each quadrat. Calculate the mean number per quadrat, then multiply by the total area of the grassland divided by the quadrat area to estimate total population size. [1]
Using mark-release-recapture for an animal species:
- Capture a sample of the animal species, count and mark them (e.g., with a small tag or non-toxic paint), then release them back into the habitat and allow time for them to mix with the unmarked population. [1]
- Capture a second sample and count how many are marked. Use the formula N=RM×C to estimate the total population size, where M = number marked and released, C = total captured in second sample, and R = number of marked individuals recaptured. [1]
Marking:
- [1] for random placement of quadrats
- [1] for calculation method for plant population
- [1] for mark-release-recapture procedure (capture, mark, release, recapture)
- [1] for use of the Lincoln-Petersen formula
19. [3]
Answer:
- Succession is the gradual and predictable change in the species composition of an ecosystem over time. [1]
- Primary succession occurs on newly exposed land where no soil exists (e.g., bare rock after a volcanic eruption). Pioneer species (e.g., lichens) colonise first, breaking down rock to form soil, which allows mosses, then grasses, then shrubs, and eventually trees to establish. [1]
- Secondary succession occurs where soil is already present but the existing community has been disturbed or removed (e.g., after a forest fire or abandoned farmland). It proceeds faster because soil and seeds are already present. [1]
- Over time, the ecosystem reaches a stable climax community — a self-sustaining community in equilibrium with the local climate, where the species composition remains relatively constant.
Marking:
- [1] for definition of succession
- [1] for primary succession (including pioneer species and soil formation)
- [1] for secondary succession (including faster rate due to existing soil)
Note: Award the third mark for either a clear description of secondary succession OR for explaining the climax community concept. The question asks for both primary and secondary succession differences, so ensure at least one mark is allocated to each type.
20. [5]
Answer:
Human activity 1 — Burning of fossil fuels:
- The combustion of fossil fuels (coal, oil, natural gas) for energy, transport, and industry releases large quantities of carbon dioxide (CO2) into the atmosphere. [1]
- This increases the concentration of CO2, a greenhouse gas, enhancing the greenhouse effect by trapping more infrared radiation in the atmosphere. [1]
Human activity 2 — Deforestation:
- Clearing forests for agriculture or development reduces the number of trees available to absorb CO2 through photosynthesis. [1]
- When trees are burned or decompose, the carbon stored in their biomass is released as CO2, further increasing atmospheric greenhouse gas concentrations. [1]
Biological consequence of global warming:
- Rising temperatures cause shifts in the geographic ranges of species, as organisms move towards higher latitudes or altitudes to find suitable temperatures. This can disrupt existing ecosystems and food webs. [1]
- (Alternative: Coral bleaching — increased sea temperatures cause corals to expel their symbiotic zooxanthellae, leading to coral death and loss of marine biodiversity. / Alternative: Changes in breeding seasons and migration patterns of animals.)
Marking:
- [1] for naming fossil fuel burning and linking to CO₂ release
- [1] for explaining how this enhances the greenhouse effect
- [1] for naming deforestation and linking to reduced CO₂ absorption
- [1] for explaining carbon release from trees
- [1] for one biological consequence of global warming
End of Answer Key
Free quiz and exam paper access
Enter your details to view this paper
Your access is remembered on this device.