From Real Exams Quiz
A Level H2 Biology Ecology Quiz
Free A Level H2 Biology Ecology quiz, DeepSeek Exam version, with questions, answers, and A Level-style practice for Singapore students.
These static practice materials are generated from the site's syllabus and paper-generation workflow, with source and model context shown so students and parents can evaluate the material before use.
Questions
A-Level Biology H2 Quiz - Ecology
Name: __________________________ Class: __________________________ Date: __________________________ Score: ________ / 52
Duration: 1 hour Total Marks: 52
Instructions:
- Answer all questions in the spaces provided.
- The number of marks is given in brackets [ ] at the end of each question or part question.
- Where appropriate, show your working.
- Use black or dark blue pen. Pencil may be used for diagrams.
Section A: Short Answer and Data Interpretation (Questions 1–5)
1. A student investigated the distribution of two plant species, Digitaria and Cynodon, along a sand dune transect from the shoreline inland. The percentage cover at each 10 m interval is shown in Fig. 1.1.
| Distance from shoreline (m) | Digitaria cover (%) | Cynodon cover (%) |
|---|---|---|
| 0 | 5 | 0 |
| 10 | 20 | 2 |
| 20 | 45 | 8 |
| 30 | 60 | 25 |
| 40 | 30 | 55 |
| 50 | 10 | 75 |
| 60 | 2 | 65 |
| 70 | 0 | 50 |
| 80 | 0 | 30 |
Fig. 1.1
(a) Describe the change in percentage cover of Digitaria along the transect. [1]
(b) With reference to ecological succession, explain the change in the relative abundance of the two species shown in Fig. 1.1. [2]
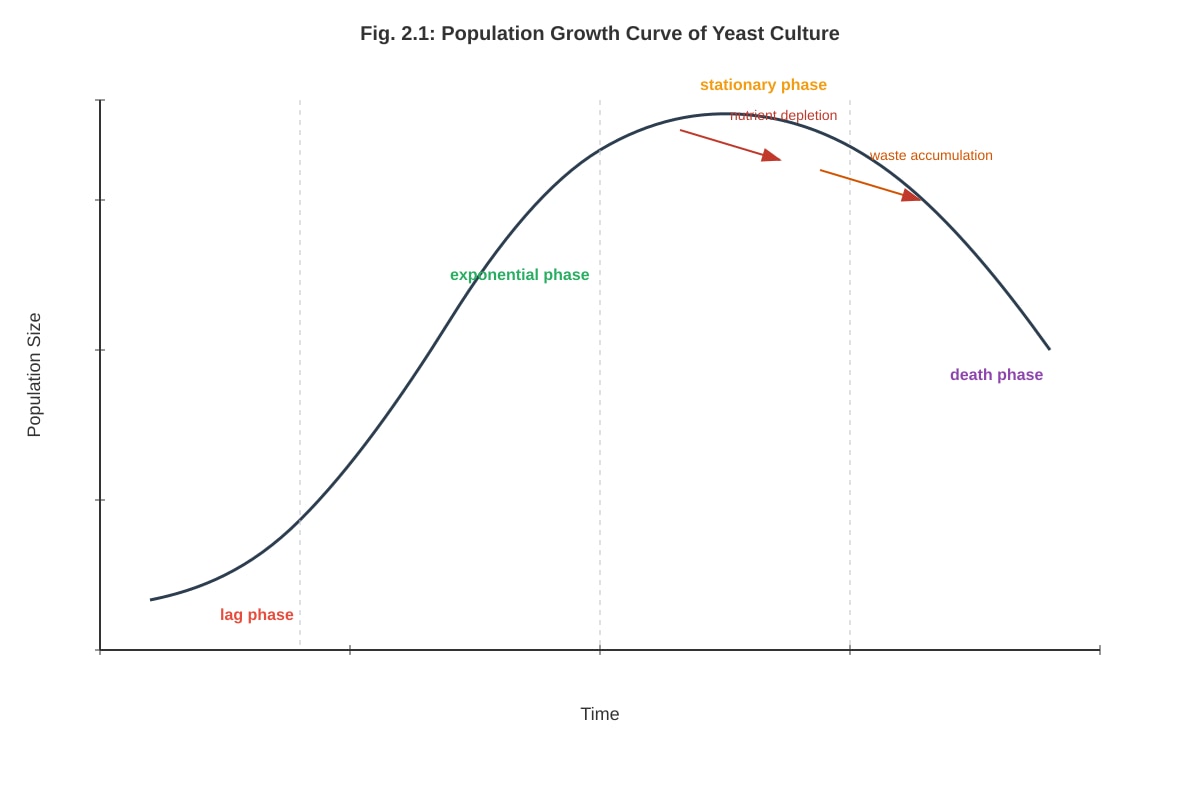
2. Fig. 2.1 shows the population growth curve of a yeast culture in a closed flask containing a limited nutrient supply.
Generated diagram for this question.
(a) State two factors that cause the growth rate to slow during the stationary phase. [1]
(b) Suggest why the death phase is delayed in a population with a high proportion of dormant cells. [1]
3. The table below gives the mean dry mass (biomass) of organisms in a freshwater pond ecosystem.
| Trophic level | Organism group | Biomass (g m⁻²) |
|---|---|---|
| Producer | Phytoplankton | 4.2 |
| Primary consumer | Zooplankton | 2.1 |
| Secondary consumer | Small fish | 0.8 |
| Tertiary consumer | Large fish | 0.3 |
(a) Draw a pyramid of biomass for this ecosystem. Label each trophic level. [2]
(b) Explain why the pyramid of biomass for a marine ecosystem dominated by very small, fast-growing phytoplankton is often inverted. [1]
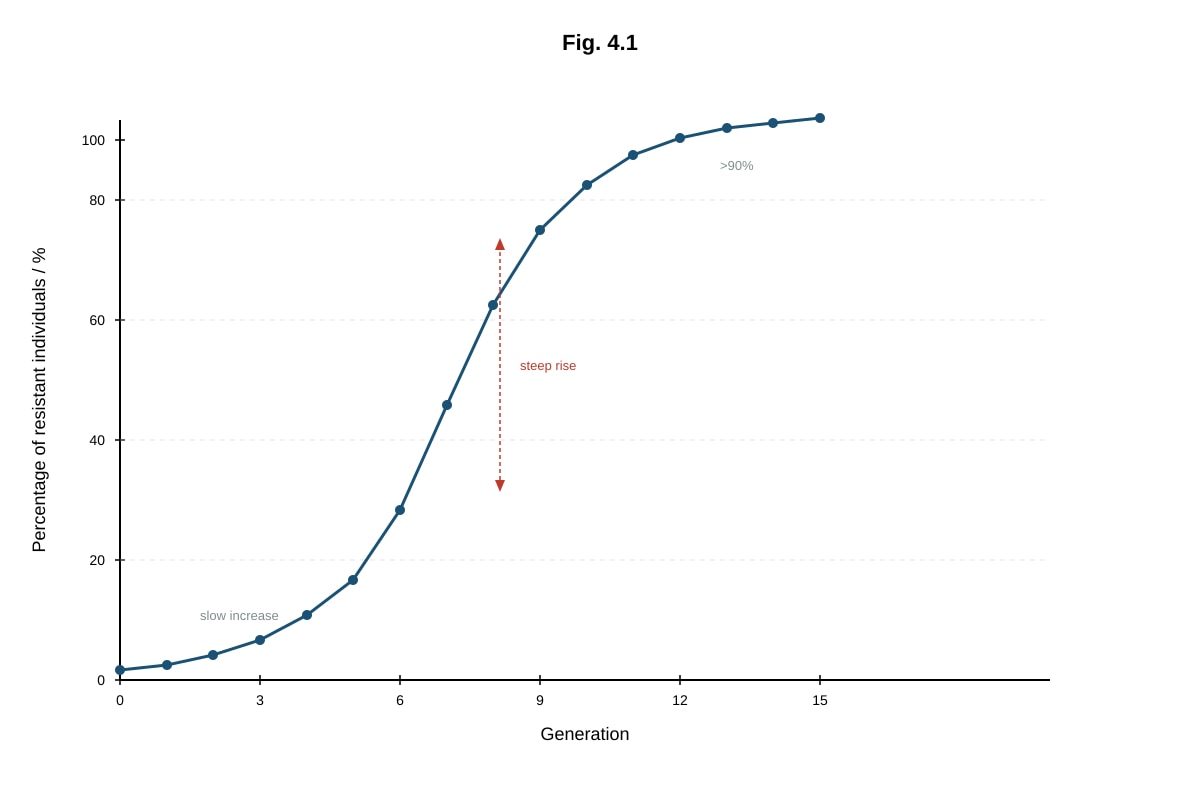
4. A farmer sprays an insecticide to control a pest on a crop. The graph in Fig. 4.1 shows the percentage of resistant individuals in the pest population over several generations.
Generated graph for this question.
(a) With reference to natural selection, explain the trend shown in Fig. 4.1. [1]
(b) Suggest one component of an integrated pest management (IPM) strategy that could reduce the selection pressure for insecticide resistance. [1]
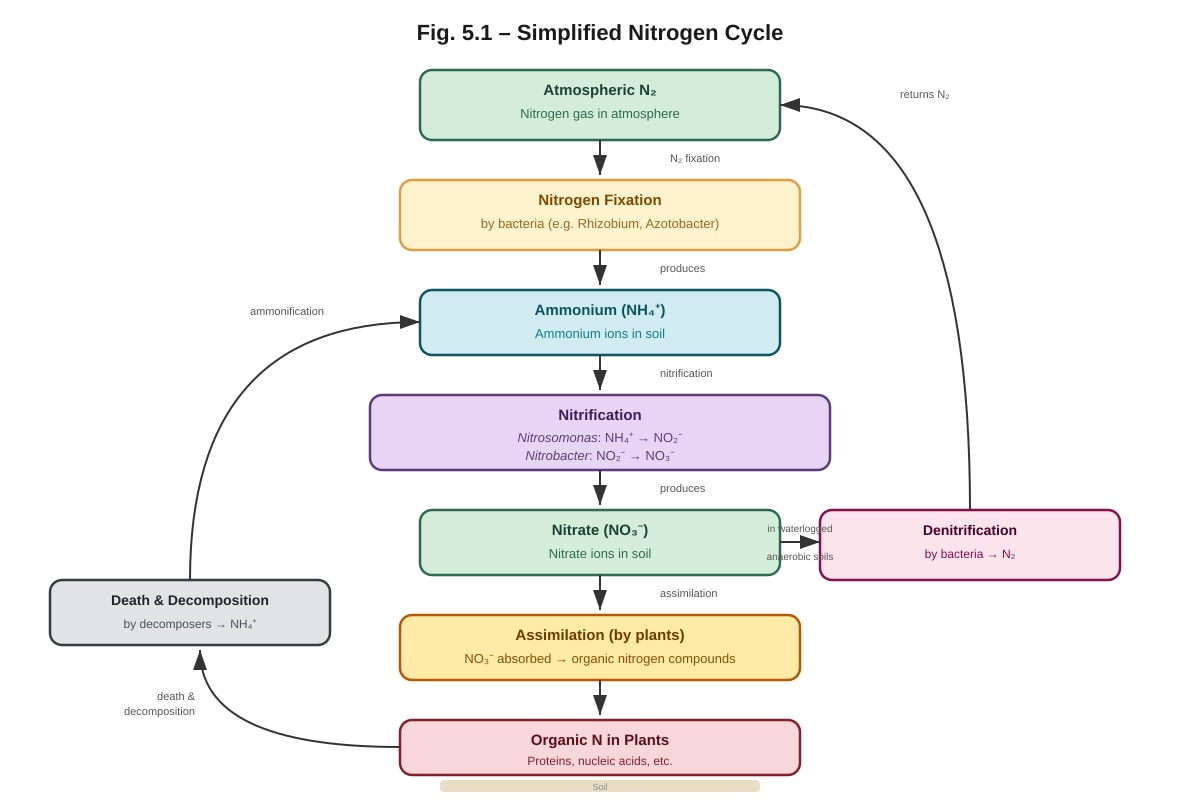
5. Fig. 5.1 is a simplified diagram of the nitrogen cycle.
Generated diagram for this question.
(a) Name the process carried out by Nitrosomonas and state the substrate it uses. [1]
(b) Explain why waterlogged soils often become deficient in nitrate ions. [2]
Section B: Structured Questions (Questions 6–10)
6. A group of ecologists estimated the population size of woodlice (Porcellio scaber) in a 50 m² area of deciduous woodland using the capture-mark-recapture method.
They collected 84 woodlice on the first occasion, marked them with a small dot of non-toxic paint, and released them. On the second occasion, 72 woodlice were collected, of which 18 were marked.
(a) State one assumption that must be made when using this method. [1]
(b) Calculate the estimated total population of woodlice in the study area. Show your working. [2]
7. Fig. 7.1 shows the energy flow through an Arctic food chain: phytoplankton → zooplankton → Arctic cod → ringed seal → polar bear. The numbers represent energy in kJ m⁻² yr⁻¹.
| Trophic level | Gross production (GPP or GSP) | Respiratory loss (R) | Net production (NPP or NSP) |
|---|---|---|---|
| Phytoplankton | 38 000 | 22 000 | 16 000 |
| Zooplankton | 4 800 | 3 200 | 1 600 |
| Arctic cod | 720 | 480 | 240 |
| Ringed seal | 90 | 72 | 18 |
| Polar bear | 9 | 8 | 1 |
(a) Calculate the percentage of the phytoplankton gross production that is transferred to net production at the zooplankton level. [1]
(b) Explain why the percentage energy transfer between trophic levels is usually less than 20%. [2]
8. Peat bogs are important carbon sinks. When drained, they become a source of carbon dioxide.
(a) Describe how peat bogs store carbon and why they are considered carbon sinks. [1]
(b) Explain the effect of draining a peat bog on the carbon cycle and on global warming. [2]
9. In a study of a rocky shore community, the distribution of two barnacle species was recorded at different heights above the mean low-tide level (Fig. 9.1).
| Height above mean low-tide (m) | Chthamalus density (individuals m⁻²) | Semibalanus density (individuals m⁻²) |
|---|---|---|
| 0.5 | 8 | 120 |
| 1.0 | 25 | 110 |
| 1.5 | 72 | 75 |
| 2.0 | 95 | 22 |
| 2.5 | 60 | 0 |
| 3.0 | 18 | 0 |
(a) Describe the distribution of Semibalanus along the height gradient. [1]
(b) Suggest one abiotic factor that may determine the upper limit of Semibalanus on the shore. [1]
10. Fig. 10.1 shows a simplified detritus food chain in a mangrove ecosystem.
Mangrove leaves → detritus → bacteria and fungi → detritivore worms → small fish → heron.
(a) Name the trophic level of the detritivore worms. [1]
(b) Explain the role of bacteria and fungi in this food chain. [1]
Section C: Data-Based Questions (Questions 11–15)
11. Fig. 11.1 shows the population cycles of the snowshoe hare and the Canada lynx over several decades.
| Year | Hare population (thousands) | Lynx population (thousands) |
|---|---|---|
| 1900 | 80 | 4 |
| 1905 | 30 | 8 |
| 1910 | 10 | 2 |
| 1915 | 100 | 1 |
| 1920 | 120 | 6 |
| 1925 | 40 | 10 |
| 1930 | 8 | 3 |
(a) Describe the relationship between the two populations. [1]
(b) Explain the observed pattern in terms of predator–prey dynamics. [2]
12. In a tropical rainforest, a student surveyed tree species in a 20 m × 20 m quadrat. The results are shown below.
| Tree species | Number of individuals (n) | (n/N)² |
|---|---|---|
| Shorea | 30 | 0.09 |
| Dipterocarpus | 25 | 0.0625 |
| Koompassia | 15 | 0.0225 |
| Eugenia | 20 | 0.04 |
| Others | 10 | 0.01 |
Total individuals, N = 100.
(a) Using the data, calculate Simpson’s Index of Diversity (D = 1 – Σ(n/N)²). Show your working. [2]
(b) Based on the calculated index, comment on the stability of this forest ecosystem. [1]
13. Fig. 13.1 is a simplified diagram of the global carbon cycle, showing major reservoirs and fluxes.
Image pending generation for this question.
(a) Identify the process labelled X that transfers carbon from the atmosphere to land biomass. [1]
(b) Explain how deforestation affects the global carbon cycle. [2]
14. A student uses a 0.5 m² quadrat to estimate the percentage cover of seaweed on a rocky shore.
(a) State one advantage of using a point quadrat over a frame quadrat. [1]
(b) Explain why a large number of quadrats is needed for an accurate estimate. [1]
15. In a deciduous forest, two species of mice, Apodemus and Clethrionomys, share the same habitat. Their diets are shown in the table.
| Food item | % in diet of Apodemus | % in diet of Clethrionomys |
|---|---|---|
| Seeds | 60 | 30 |
| Fruits | 20 | 10 |
| Insects | 5 | 50 |
| Leaves and stems | 15 | 10 |
(a) Define the term ecological niche. [1]
(b) Explain how differences in diet allow the two species to coexist. [2]
Section D: Extended Response (Questions 16–20)
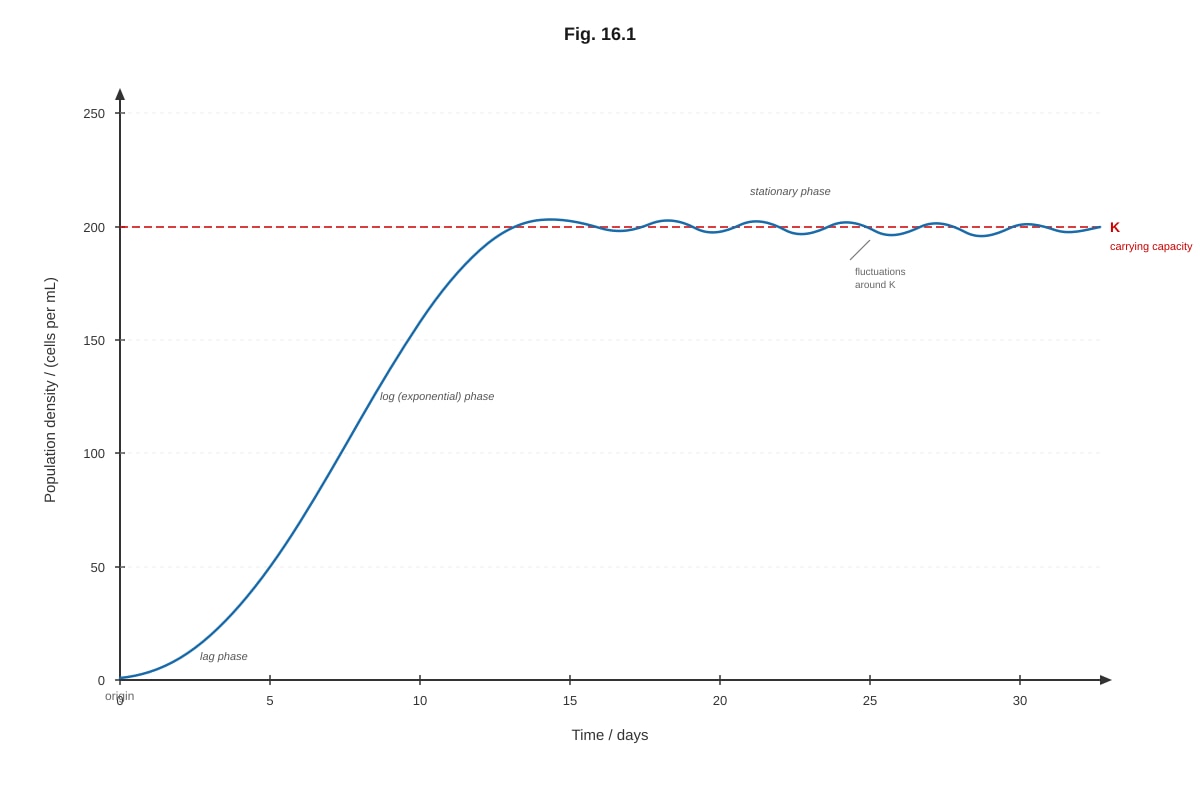
16. Fig. 16.1 shows the growth curve of a laboratory population of Paramecium in a culture flask with a fixed amount of food.
Generated diagram for this question.
(a) State one density-dependent factor that could limit population size in this culture. [1]
(b) Explain how this factor regulates population size around the carrying capacity. [2]
17. Leguminous plants such as soybeans form root nodules containing nitrogen-fixing bacteria.
(a) Name the type of symbiotic relationship between the plant and the bacteria, and explain the benefit to the plant. [2]
(b) Explain how the bacteria benefit from the relationship. [1]
18. A lake receives a large input of nitrate and phosphate fertilisers from surrounding farmland.
(a) Describe the sequence of events that leads to an algal bloom after fertiliser runoff enters the lake. [1]
(b) Explain how the algal bloom can result in the death of fish. [2]
19. Fig. 19.1 shows the stages of primary succession on a bare, cooled lava flow.
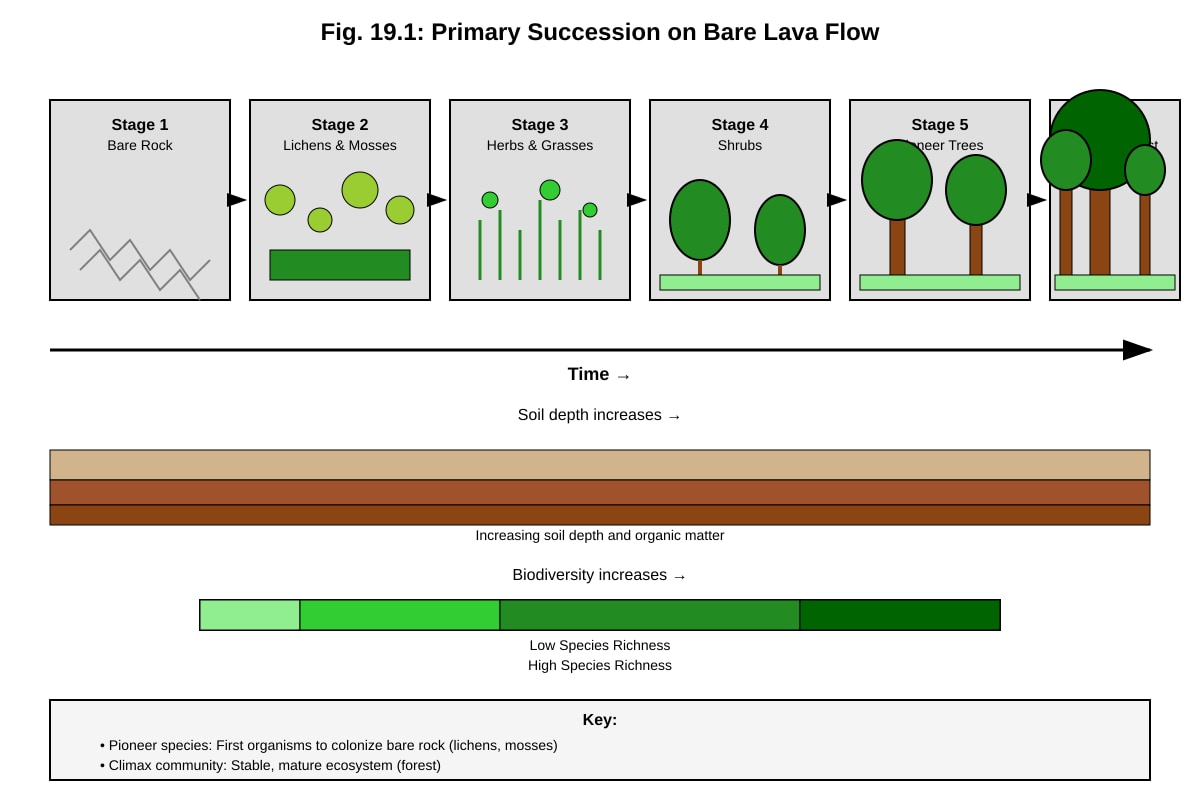
Generated diagram for this question.
(a) Define the term pioneer species. [1]
(b) State one way pioneer species modify the environment, making it suitable for later species. [1]
20. A study recorded the northern range limit of the comma butterfly (Polygonia c-album) in Britain between 1970 and 2000. The limit shifted northwards by 150 km over the period.
Assume a 1°C rise in local mean annual temperature occurred during the same period.
(a) Explain how global warming could cause this northward shift. [2]
END OF QUIZ
Answers
A-Level Biology H2 Quiz - Ecology - Answer Key
Total Marks: 52
Section A: Questions 1–5
1. (a)
Increase from 5% at 0 m to a peak of 60% at 30 m, then decline to 0% by 70 m. [1]
(b)
- Pioneer species Digitaria tolerates harsh conditions (low nutrients, salt spray) and colonises first. [1]
- As soil develops, more competitive species like Cynodon establish and outcompete Digitaria, causing its decline (succession). [1]
2. (a)
Any two from: nutrient depletion, accumulation of toxic waste (e.g., ethanol), lack of oxygen. (Award 1 mark for two valid factors) [1]
(b)
Dormant cells are metabolically inactive, so they resist adverse conditions longer; the population decline is postponed because a large fraction of cells are not immediately killed. [1]
3. (a)
Pyramid of biomass: rectangle widths proportional to biomass:
- Phytoplankton (4.2) → base widest
- Zooplankton (2.1)
- Small fish (0.8)
- Large fish (0.3) → top narrowest.
(2 marks: 1 for correct shape and ordering, 1 for correct labelling of trophic levels)
(b)
Phytoplankton have a high turnover rate; they are eaten rapidly, so standing crop biomass is low. Therefore, consumer biomass (zooplankton) can exceed producer biomass, creating an inverted pyramid. [1]
4. (a)
Genetic variation means some pests carry resistance alleles. Insecticide kills susceptible pests, so resistant ones survive and reproduce, increasing the frequency of resistance alleles over generations → percentage resistant rises. [1]
(b)
Any valid IPM component, e.g.: biological control (use of predators/parasitoids), crop rotation, resistant crop varieties, mechanical traps, or monitoring to spray only when pest numbers reach a threshold. [1]
5. (a)
Process: oxidation of ammonium (or nitrification to nitrite). [1]
Substrate: ammonium ions (NH₄⁺). [1]
(b)
- Waterlogged soil is anaerobic → denitrifying bacteria convert nitrate (NO₃⁻) to N₂ gas, which is lost. [1]
- Nitrifying bacteria need oxygen, so nitrification stops; nitrate is not replenished, leading to low nitrate levels. [1]
Section B: Questions 6–10
6. (a)
Any one: no immigration/emigration, marking does not affect survival or catchability, marks not lost, marked individuals mix randomly. [1]
(b)
N = (M × C) / R
M = 84, C = 72, R = 18
N = (84 × 72) / 18 = 6048 / 18 = 336
Estimated population = 336 woodlice. [2] (1 mark for formula/substitution, 1 for correct answer)
7. (a)
Percentage = (net production zooplankton / gross production phytoplankton) × 100
= (1600 / 38000) × 100 = 4.21% (allow 4.2%). [1]
(b)
- Energy lost as heat via respiration at each level. [1]
- Not all biomass is eaten or digested; excretion, egested material, and non-digestible parts (e.g., bones) are energy lost. Therefore, only a small fraction becomes net production available to the next level. [1]
8. (a)
- Waterlogged, anaerobic, acidic conditions slow decomposition. [0.5]
- Dead plant material accumulates as partially decomposed peat, storing carbon. [0.5]
(Award 1 mark for both points) [1]
(b)
- Draining introduces oxygen → aerobic microbes decompose peat, releasing stored carbon as CO₂. [1]
- CO₂ is a greenhouse gas, so its release enhances the greenhouse effect, contributing to global warming. [1]
9. (a)
Semibalanus density decreases with height: highest at 0.5 m (120 per m²), then declines to zero above 2.0 m; restricted to lower shore. [1]
(b)
Any one: desiccation stress, temperature extremes, or reduced feeding time (shorter submersion). [1]
10. (a)
Primary consumer (second trophic level). [1]
(b)
Bacteria and fungi are decomposers/saprotrophs; they secrete enzymes to break down detritus externally, releasing soluble nutrients and making energy available to detritivores. [1]
Section C: Questions 11–15
11. (a)
Lynx population tends to rise and fall after hare population changes, showing a cyclic relationship with a lag. [1]
(b)
- An increase in hares provides more food for lynx, so lynx population rises. [1]
- As lynx numbers increase, predation pressure reduces hare population, which then limits food for lynx causing lynx numbers to decline. The cycle repeats. [1]
12. (a)
Sum of (n/N)² = 0.09 + 0.0625 + 0.0225 + 0.04 + 0.01 = 0.225
D = 1 – 0.225 = 0.775 [2] (1 mark for summing, 1 mark for correct index)
(b)
D = 0.775 indicates high diversity; diverse ecosystems are generally more stable and resilient to disturbance. [1]
13. (a)
Process X: photosynthesis. [1]
(b)
- Deforestation removes trees that would otherwise photosynthesise and store carbon in biomass, reducing carbon uptake from the atmosphere. [1]
- Decay or burning of felled trees releases stored carbon as CO₂, increasing atmospheric CO₂, which enhances the greenhouse effect. [1]
14. (a)
Point quadrat gives more objective/repeatable measurements because it records presence/absence at specific points rather than estimated by eye, reducing observer bias. [1]
(b)
A large number of quadrats ensures the sample is representative of the whole area, reducing the effects of patchiness and increasing the reliability of the estimate. [1]
15. (a)
An ecological niche is the role of a species within its environment, including its interactions with biotic and abiotic factors, and its habitat, resource use, and behaviour. [1]
(b)
- The two species utilise different proportions of food resources (e.g., Apodemus eats mainly seeds, Clethrionomys prefers insects). [1]
- This resource partitioning reduces direct competition for the same food source, allowing coexistence. [1]
Section D: Questions 16–20
16. (a)
Accept any one: competition for food, accumulation of toxic waste, or disease (density-dependent factor). [1]
(b)
- As population approaches K, food becomes limiting, increasing competition. [1]
- This leads to lower birth rate and/or higher death rate, causing the population to stabilise around K (or fluctuate slightly). [1]
17. (a)
Mutualism. [1]
- Bacteria fix atmospheric nitrogen into ammonia/ammonium, which the plant uses to synthesise amino acids, proteins, etc., enhancing plant growth. [1]
(b)
Bacteria receive carbohydrates/organic compounds (energy source) from the plant’s photosynthesis. [1]
18. (a)
Nutrient (nitrate/phosphate) enrichment causes rapid multiplication of algae, forming an algal bloom. [1]
(b)
- Algal bloom blocks sunlight, so submerged plants die. [1]
- Decomposition of dead algae by aerobic bacteria depletes oxygen → hypoxia/anoxia leads to fish suffocation. [1]
19. (a)
A pioneer species is the first species to colonise bare rock or disturbed habitat, able to tolerate extreme conditions. [1]
(b)
Lichens/mosses weather rock to form soil (or add organic matter), allowing later plants to grow. [1]
20. (a)
- Global warming raises temperatures, making previously cooler northern areas suitable for the butterfly in terms of thermal tolerance. [1]
- The butterfly expands its range northwards as conditions become favourable, tracking its fundamental niche; the range limit shifts. [1]
Free quiz and exam paper access
Enter your details to view this paper
Your access is remembered on this device.