AI Generated Exam Paper
A Level H2 Biology Practice Paper 1
Free A Level H2 Biology Practice Paper 1, LongCat AI version, with questions, answers, and A Level-style practice for Singapore students.
These static practice materials are generated from the site's syllabus and paper-generation workflow, with source and model context shown so students and parents can evaluate the material before use.
Questions
TuitionGoWhere Practice Paper - Biology H2 A-Level
TuitionGoWhere Practice Paper (AI)
Subject: Biology Level: A-Level H2 Paper: Practice Paper — Cells & Biomolecules Duration: 1 hour 30 minutes Total Marks: 50 Name: ___________________________ Class: ___________________________ Date: ___________________________
Instructions
- Answer all questions in the spaces provided.
- Write your answers in the blank spaces or on lined pages as indicated.
- The number of marks for each question or part-question is shown in brackets [ ].
- You are advised to spend no more than 20 minutes on Section A, 30 minutes on Section B, and 40 minutes on Section C.
- Credit will be given for the correct use of biological terminology and for clear, well-organised answers.
- Where a question requires explanation or description, answers should be written in continuous prose where appropriate.
Section A: Multiple Choice [10 marks]
Questions 1–10: Each question is worth 1 mark. Choose the single best answer.
1. Which of the following organelles is present in both prokaryotic and eukaryotic cells?
A. Nucleus B. Mitochondrion C. Ribosome D. Endoplasmic reticulum
Answer: ______________ [1]
2. A student observed a cell under an electron microscope and noted an organelle consisting of a stack of flattened membrane-bound cisternae. This organelle is most likely the
A. rough endoplasmic reticulum. B. Golgi apparatus. C. smooth endoplasmic reticulum. D. lysosome.
Answer: ______________ [1]
3. Which property of water is most directly responsible for its role as a solvent for ionic biological molecules?
A. High specific heat capacity B. High latent heat of vaporisation C. Cohesion between water molecules D. Polarity of the water molecule
Answer: ______________ [1]
4. The diagram below shows a section of a phospholipid bilayer.
Image pending generation: diagram for Q4.
Which statement best explains why phospholipids spontaneously form a bilayer in aqueous environments?
A. The hydrophobic heads repel water and orient away from the aqueous environment. B. The hydrophilic tails are attracted to water and orient towards the aqueous environment. C. The hydrophobic tails repel water and orient away from the aqueous environment, while the hydrophilic heads interact with water. D. The hydrophilic heads repel each other and force the tails to face outward.
Answer: ______________ [1]
5. Which of the following is a function of cholesterol in the cell membrane?
A. It increases membrane fluidity at all temperatures. B. It decreases membrane fluidity at high temperatures and increases fluidity at low temperatures. C. It acts as a receptor for signalling molecules. D. It provides energy for active transport across the membrane.
Answer: ______________ [1]
6. A reducing sugar test was performed on four unknown solutions. A brick-red precipitate was observed only in solution X. Which molecule is most likely present in solution X?
A. Sucrose B. Starch C. Glucose D. Glycogen
Answer: ______________ [1]
7. Which of the following bonds is responsible for linking amino acids together in a polypeptide chain?
A. Hydrogen bond B. Ionic bond C. Peptide bond D. Disulfide bond
Answer: ______________ [1]
8. An enzyme has an optimal pH of 7.4. If the pH of the environment is changed to 3.0, which of the following best explains the decrease in enzyme activity?
A. The substrate concentration decreases at low pH. B. The enzyme's active site becomes denatured due to disruption of ionic bonds and hydrogen bonds, altering the tertiary structure. C. The enzyme is hydrolysed into amino acids. D. The activation energy of the reaction increases.
Answer: ______________ [1]
9. Which of the following correctly describes the relationship between the structure of a protein and its function?
A. The primary structure determines the tertiary structure, which determines function. B. The quaternary structure alone determines function. C. The secondary structure is independent of the primary structure. D. The tertiary structure is determined only by disulfide bonds.
Answer: ______________ [1]
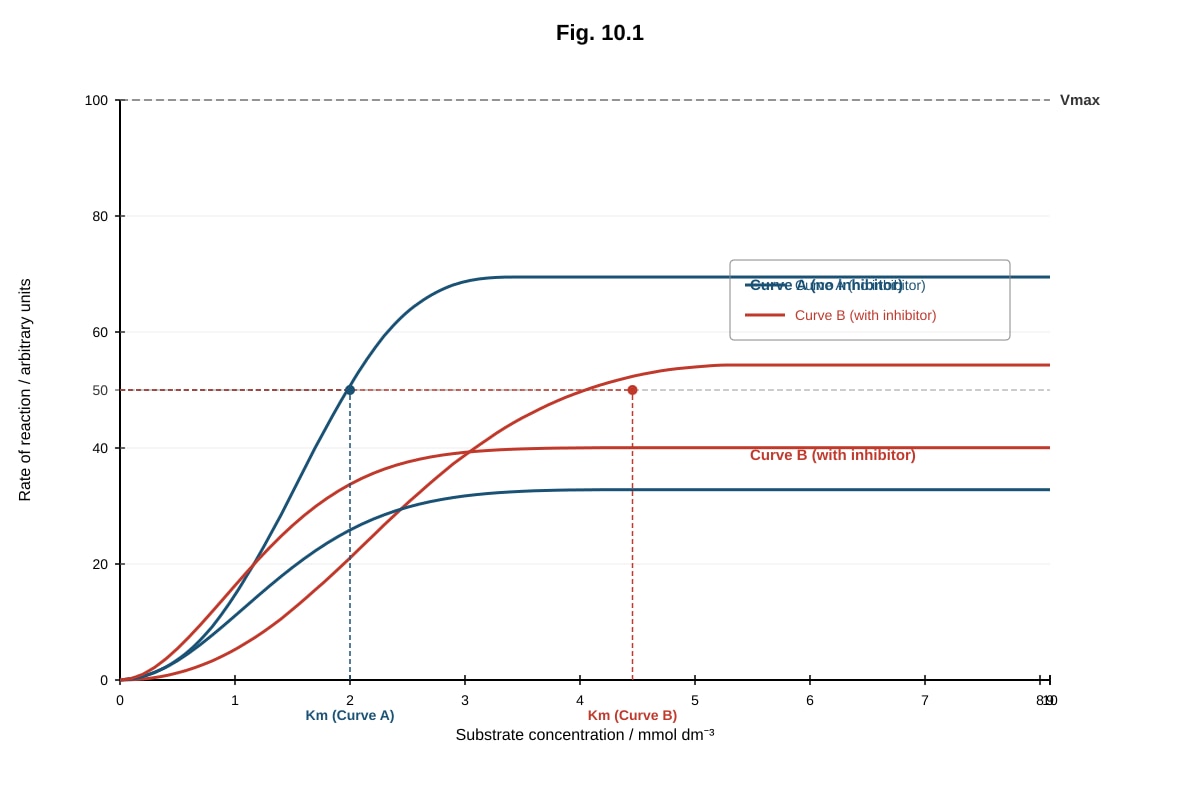
10. Fig. 10.1 shows the effect of substrate concentration on the rate of an enzyme-catalysed reaction in the absence and presence of an inhibitor.
Generated graph for Q10.
With reference to Fig. 10.1, which type of inhibition is shown?
A. Non-competitive inhibition, because Vmax is unchanged. B. Competitive inhibition, because Vmax is unchanged and the apparent Km increases. C. Non-competitive inhibition, because the apparent Km increases. D. Competitive inhibition, because Vmax decreases.
Answer: ______________ [1]
Section B: Structured Questions [20 marks]
Questions 11–15: Answer all questions. Write your answers in the spaces provided.
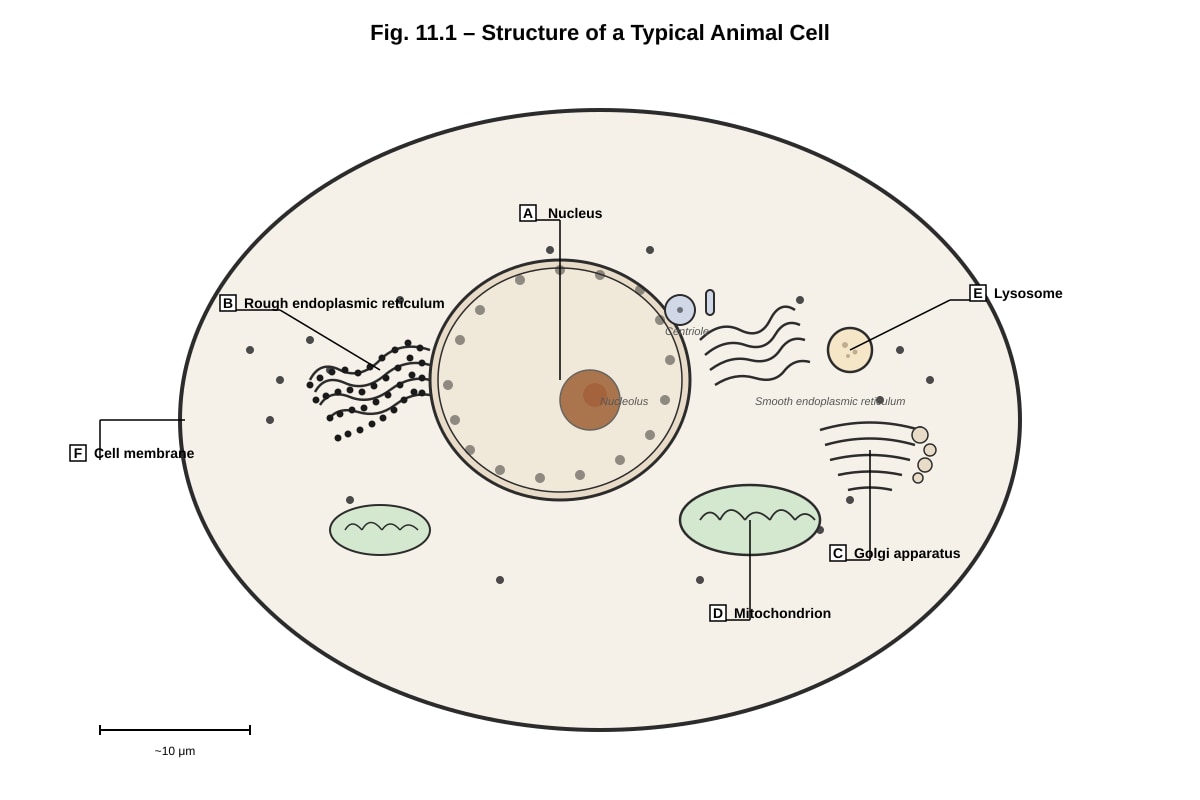
11. Fig. 11.1 shows the structure of a typical animal cell as seen under an electron microscope.
Generated diagram for Q11.
(a) Identify the organelles labelled A and C. [2]
A: _______________________________________________
C: _______________________________________________
(b) State one function of the organelle labelled B. [1]
(c) Explain why organelle D is described as the "powerhouse of the cell." [2]
(d) Describe the role of organelle E in the cell. [2]
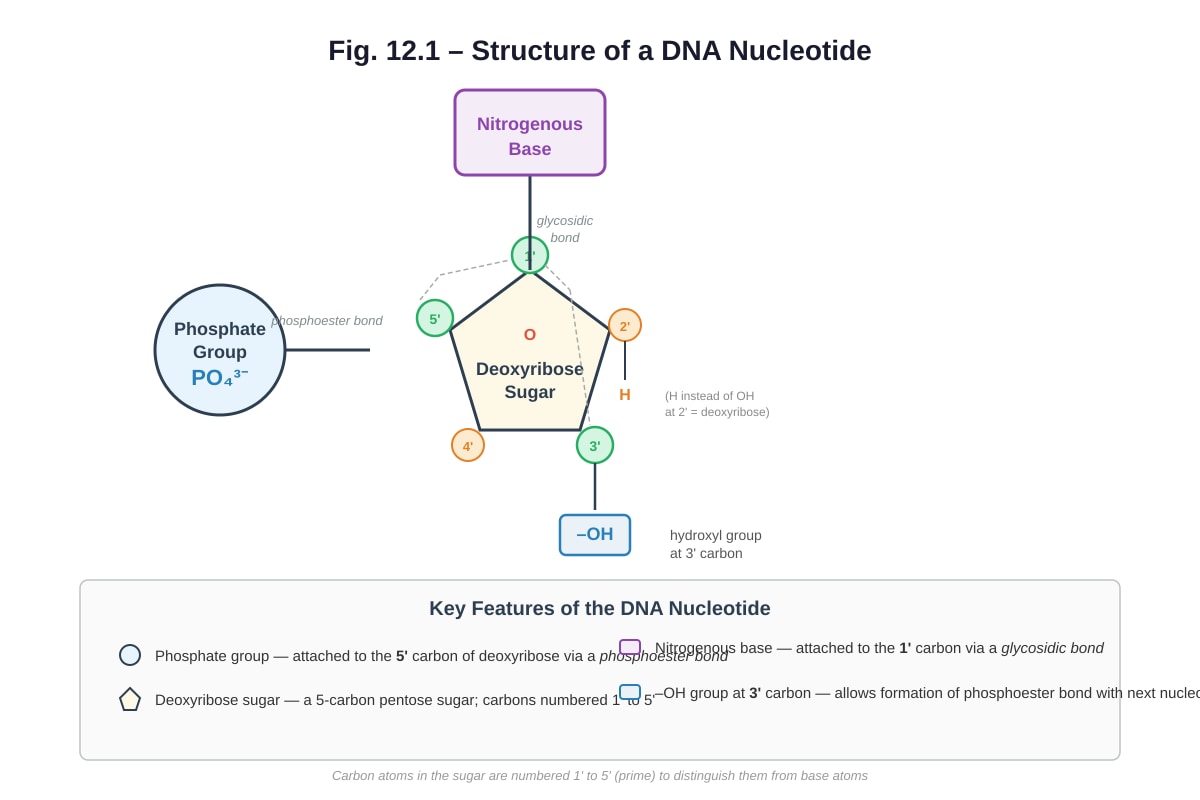
12. Fig. 12.1 shows the structure of a nucleotide found in DNA.
Generated diagram for Q12.
(a) Name the type of bond that links the phosphate group to the deoxyribose sugar in a single nucleotide. [1]
(b) Name the type of bond that links two nucleotides together to form a polynucleotide chain. [1]
(c) Explain how the structure of DNA allows it to carry genetic information. [3]
(d) Describe how the complementary base pairing in DNA contributes to the accuracy of DNA replication. [2]
13. A student investigated the effect of temperature on the activity of the enzyme catalase. Potato cubes of equal size were placed into hydrogen peroxide (H2O2) solutions at different temperatures. The volume of oxygen gas produced in the first 60 seconds was measured. The results are shown in Table 13.1.
Table 13.1
| Temperature / °C | Volume of O2 produced in 60 s / cm³ |
|---|---|
| 10 | 2.1 |
| 20 | 4.8 |
| 30 | 8.5 |
| 40 | 12.3 |
| 50 | 9.7 |
| 60 | 3.2 |
| 70 | 0.4 |
(a) Describe the trend shown in Table 13.1. [2]
(b) Explain the decrease in the volume of oxygen produced at temperatures above 40 °C. [3]
(c) Suggest why the student used potato cubes of equal size in this experiment. [1]
(d) State one other variable that should be kept constant in this experiment, other than the size of the potato cubes. [1]
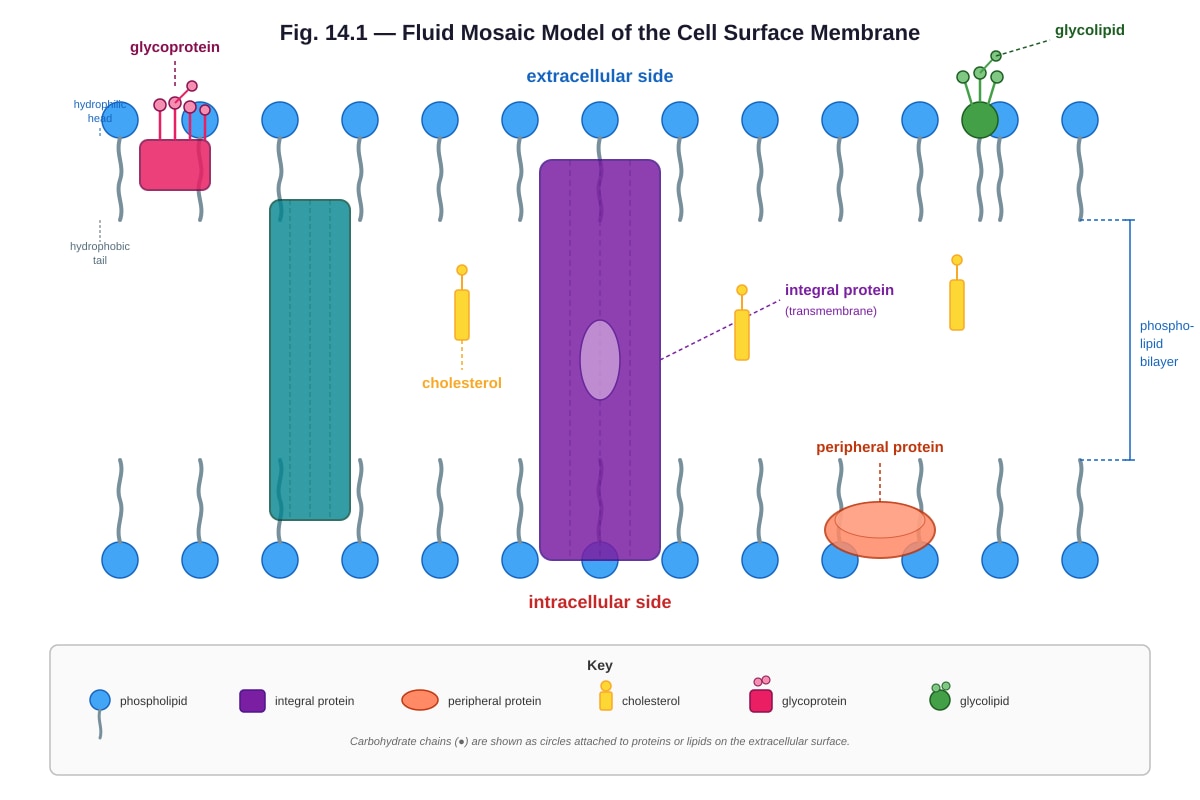
14. Fig. 14.1 shows the fluid mosaic model of the cell surface membrane.
Generated diagram for Q14.
(a) With reference to Fig. 14.1, name the molecules labelled X and Y. [2]
X: _______________________________________________
Y: _______________________________________________
(b) Explain why the model is described as "fluid mosaic." [2]
(c) Describe the role of cholesterol in the cell surface membrane. [2]
(d) Explain how the structure of the glycoprotein enables it to function as a cell surface receptor. [2]
15. Fig. 15.1 shows the structures of four amino acids.
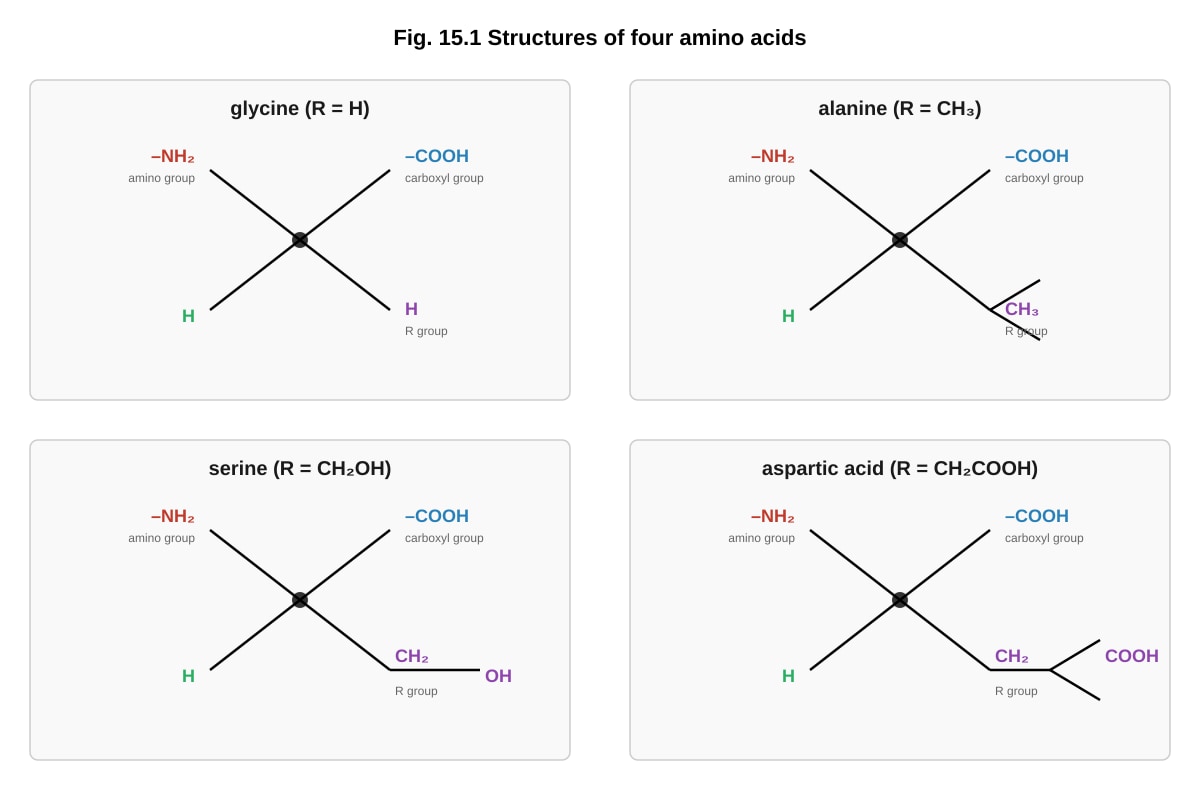
Generated diagram for Q15.
(a) State the general formula of an amino acid as shown in Fig. 15.1. [1]
(b) Name the reaction that joins two amino acids together and identify the bond formed. [2]
(c) Explain how the R group of an amino acid influences the tertiary structure of a protein. [3]
(d) Aspartic acid has a negatively charged R group at physiological pH. Predict how this would affect its position in a globular protein in an aqueous environment. [2]
Section C: Free Response [20 marks]
Questions 16–20: Answer all questions. Write your answers in the spaces provided. You are advised to plan your answers to parts (c) and (d) of each question before writing.
16. Fig. 16.1 shows the process of protein synthesis in a eukaryotic cell.
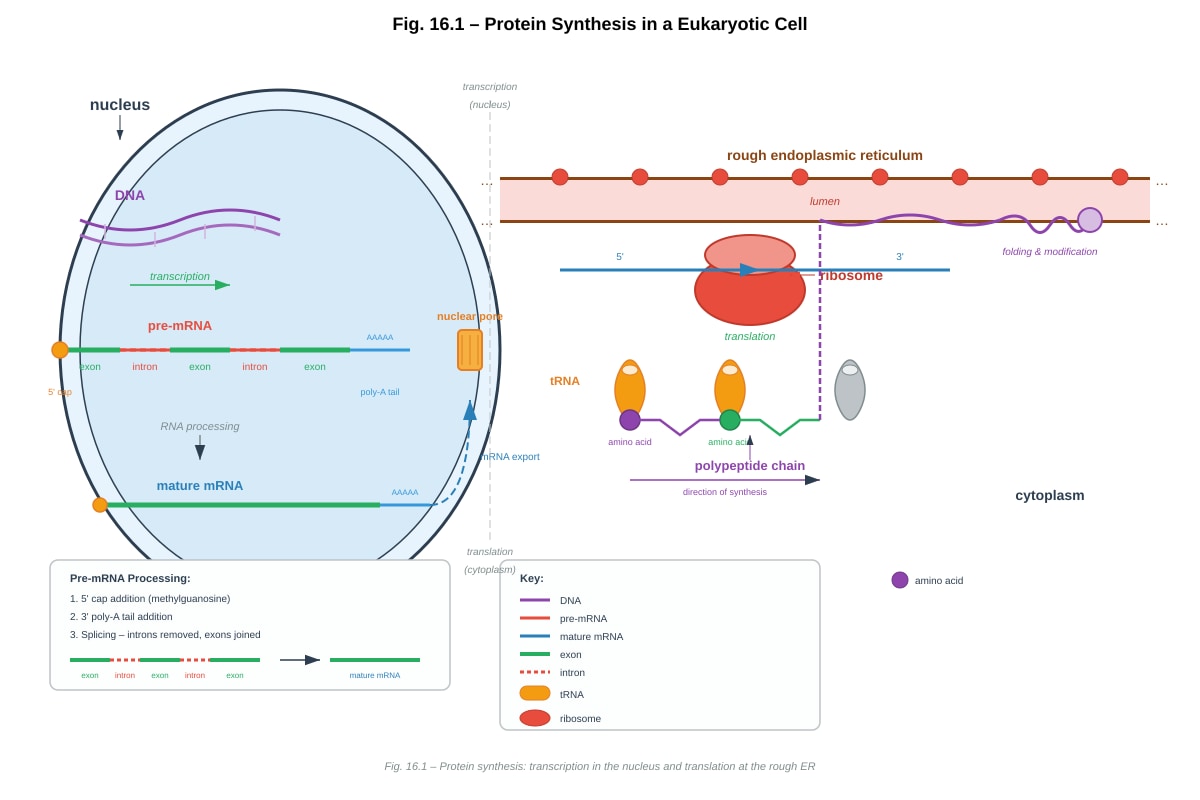
Generated diagram for Q16.
(a) State where transcription occurs in a eukaryotic cell. [1]
(b) Describe the role of tRNA in translation. [2]
(c) Explain how the structure of mRNA enables it to carry genetic information from the nucleus to the ribosome. [3]
(d) Compare and contrast the processes of transcription and translation in eukaryotic cells. [4]
17. A student carried out an investigation to identify the biological molecules present in three unknown food samples, P, Q, and R. The results are shown in Table 17.1.
Table 17.1
| Test | Reagent used | Sample P | Sample Q | Sample R |
|---|---|---|---|---|
| Test for reducing sugar | Benedict's solution | Blue | Brick-red precipitate | Blue |
| Test for protein | Biuret reagent | Pale blue | Pale blue | Violet/purple |
| Test for starch | Iodine solution | Blue-black | Blue | Blue |
| Test for lipid | Ethanol emulsion test | Cloudy white emulsion | Clear | Clear |
(a) Identify the biological molecules present in each sample. [3]
Sample P: _______________________________________________
Sample Q: _______________________________________________
Sample R: _______________________________________________
(b) Describe how the ethanol emulsion test for lipids is carried out. [2]
(c) Explain why Benedict's test is classified as a test for reducing sugars rather than for all sugars. [2]
(d) A student suggested that sample Q contains sucrose. Explain how the student could test this suggestion. [3]
18. Fig. 18.1 shows the effect of substrate concentration on the rate of an enzyme-catalysed reaction under three different conditions: without inhibitor, with inhibitor X, and with inhibitor Y.
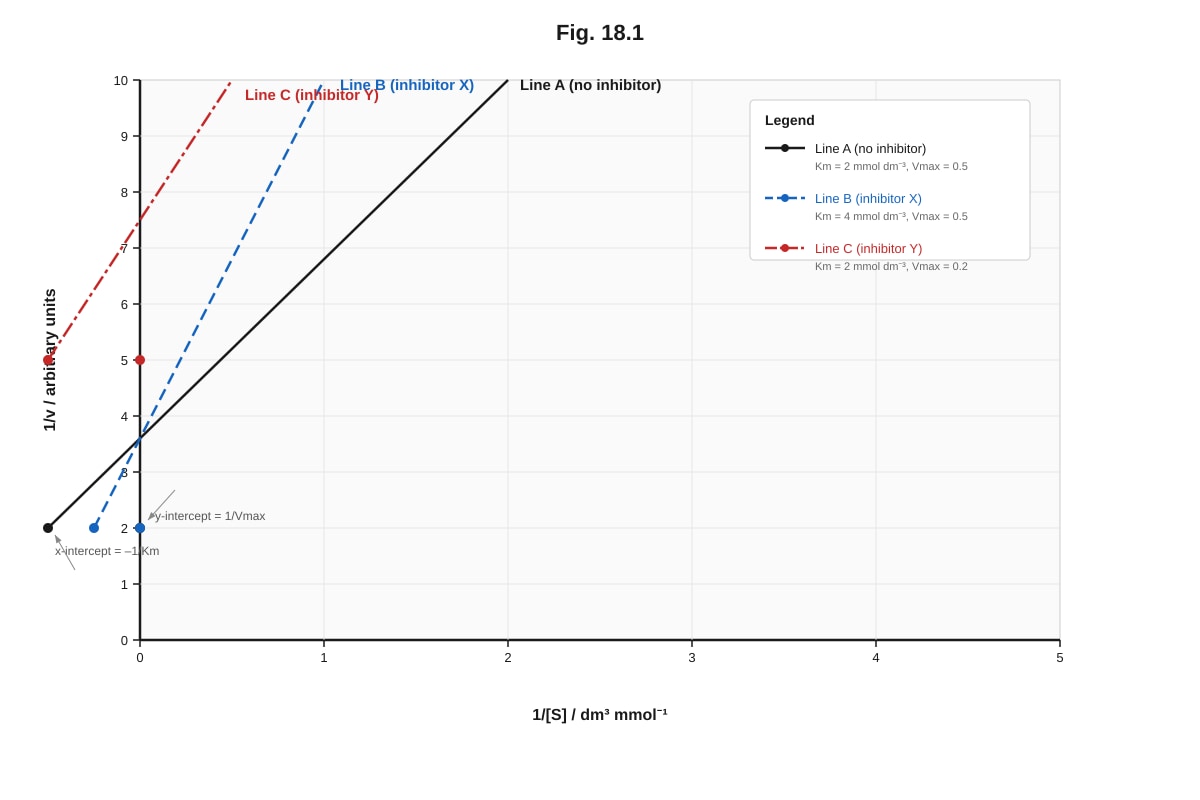
Generated graph for Q18.
(a) With reference to Fig. 18.1, state the type of inhibition shown by inhibitor X and explain your answer. [3]
(b) State the type of inhibition shown by inhibitor Y and explain your answer. [3]
(c) Explain how competitive inhibition can be overcome. [2]
(d) Give one biological example of feedback inhibition and explain its significance in metabolism. [2]
19. Fig. 19.1 shows a comparison between prokaryotic and eukaryotic cells.
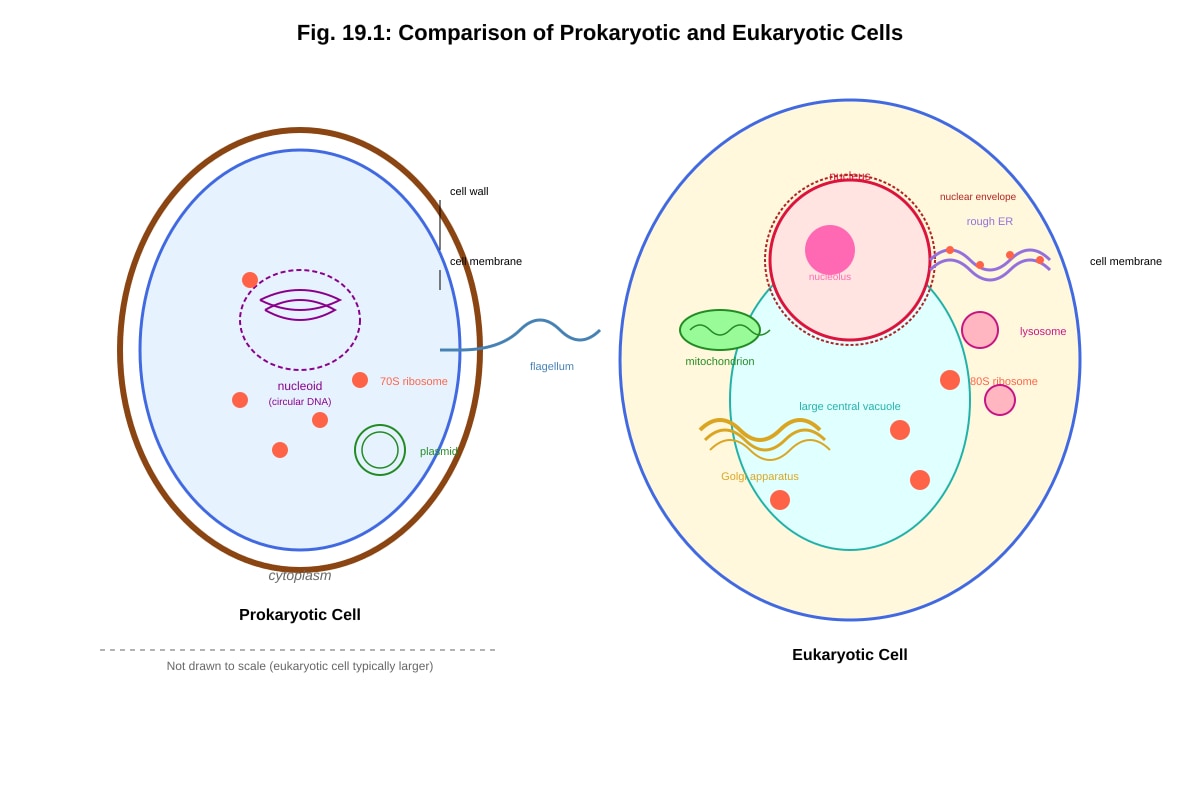
Generated diagram for Q19.
(a) State two structural differences between prokaryotic and eukaryotic cells visible in Fig. 19.1. [2]
(b) Explain why prokaryotic cells are generally smaller than eukaryotic cells. [2]
(c) Describe the functions of the following structures found in prokaryotic cells: [4]
(i) Cell wall:
(ii) Plasmid:
(d) Explain the significance of compartmentalisation in eukaryotic cells. [2]
20. Read the following passage and answer the questions that follow.
The Discovery of the Cell and the Cell Theory
The cell was first discovered by Robert Hooke in 1665 when he observed thin slices of cork under a microscope. He saw small, empty compartments which he called "cells." Later, Antonie van Leeuwenhoek observed living cells, including bacteria and protozoa, using his improved microscopes. In the 19th century, Matthias Schleiden and Theodor Schwann proposed the cell theory, which states that all living organisms are composed of cells, and that cells are the basic unit of life. Rudolf Virchow later added that all cells arise from pre-existing cells.
The development of the electron microscope in the 20th century revolutionised cell biology, allowing scientists to observe the internal ultrastructure of cells at nanometre resolution. Transmission electron microscopy (TEM) uses a beam of electrons transmitted through a thin specimen to produce detailed images of internal structures, while scanning electron microscopy (SEM) produces three-dimensional images of cell surfaces.
Modern cell biology integrates knowledge of cell structure with molecular biology to understand how cells function. The study of biological molecules — including carbohydrates, lipids, proteins, and nucleic acids — has revealed how the chemical properties of these molecules determine their biological roles. For example, the amphipathic nature of phospholipids drives the spontaneous formation of bilayers in aqueous environments, which is fundamental to the structure of all biological membranes.
(a) State the three main principles of the cell theory. [3]
(b) Explain how the development of the electron microscope advanced the study of cell biology. [2]
(c) Describe one key difference between transmission electron microscopy (TEM) and scanning electron microscopy (SEM). [1]
(d) Explain what is meant by the term "amphipathic" and how this property of phospholipids is important for membrane formation. [4]
Answers
TuitionGoWhere Practice Paper — Biology H2 A-Level
Answer Key: Cells & Biomolecules (Version 1)
Section A: Multiple Choice [10 marks]
1. C — Ribosome [1]
- Explanation: Ribosomes are the only organelles listed that are found in both prokaryotic and eukaryotic cells. They are non-membrane-bound and are essential for protein synthesis in all living cells. The nucleus, mitochondrion, and endoplasmic reticulum are membrane-bound organelles found only in eukaryotic cells.
- Common mistake: Students may select mitochondrion, thinking all cells need energy production. However, prokaryotes carry out respiration at the cell membrane, not in mitochondria.
2. B — Golgi apparatus [1]
- Explanation: The Golgi apparatus is characterised by a stack of flattened, membrane-bound cisternae. The rough endoplasmic reticulum is a network of membranes with ribosomes attached (not stacked cisternae), the smooth ER lacks ribosomes and is tubular, and lysosomes are small, spherical vesicles.
- Common mistake: Students may confuse the Golgi apparatus with the rough ER. The key distinguishing feature is the stacked, flattened cisternae of the Golgi.
3. D — Polarity of the water molecule [1]
- Explanation: Water is a polar molecule due to the unequal sharing of electrons between oxygen and hydrogen atoms. The partial positive charge on hydrogen atoms and partial negative charge on oxygen allow water to surround and dissolve ionic compounds by attracting oppositely charged ions. High specific heat capacity, latent heat, and cohesion are important properties but do not directly explain water's solvent properties.
- Teaching note: The polarity of water arises because oxygen is more electronegative than hydrogen, creating a dipole moment.
4. C — The hydrophobic tails repel water and orient away from the aqueous environment, while the hydrophilic heads interact with water. [1]
- Explanation: Phospholipids are amphipathic molecules with hydrophilic (water-loving) phosphate heads and hydrophobic (water-fearing) fatty acid tails. In an aqueous environment, the hydrophobic effect drives the tails to orient away from water, while the hydrophilic heads interact with the aqueous medium, resulting in spontaneous bilayer formation.
- Common mistake: Students often confuse which part is hydrophilic and which is hydrophobic. Remember: "heads love water, tails fear water."
- Image note: The diagram should clearly show hydrophilic heads (circles) facing the aqueous extracellular and intracellular environments, with hydrophobic tails (wavy lines) facing each other in the interior of the bilayer.
5. B — It decreases membrane fluidity at high temperatures and increases fluidity at low temperatures. [1]
- Explanation: Cholesterol acts as a buffer for membrane fluidity. At high temperatures, cholesterol restricts the movement of phospholipid fatty acid tails, reducing fluidity and preventing the membrane from becoming too permeable. At low temperatures, cholesterol prevents the fatty acid tails from packing too closely together, maintaining some fluidity and preventing the membrane from becoming too rigid.
- Common mistake: Students may think cholesterol only increases or only decreases fluidity. It actually has a dual, stabilising role.
6. C — Glucose [1]
- Explanation: Benedict's test detects reducing sugars, which have a free aldehyde or ketone group that can reduce Cu2+ ions (blue) in Benedict's solution to Cu+, forming a brick-red precipitate of copper(I) oxide. Glucose is a reducing sugar. Sucrose is a non-reducing sugar (its glycosidic bond involves both anomeric carbons), and starch and glycogen are polysaccharides that do not give a positive Benedict's test under standard conditions.
- Teaching note: Students should remember that all monosaccharides are reducing sugars, but not all disaccharides are (sucrose is the exception).
7. C — Peptide bond [1]
- Explanation: Amino acids are linked by peptide bonds, which form between the carboxyl group (–COOH) of one amino acid and the amino group (–NH₂) of another in a condensation reaction, releasing a molecule of water. Hydrogen bonds stabilise secondary structure, ionic bonds can form between charged R groups, and disulfide bonds form between cysteine residues in tertiary structure.
- Common mistake: Students may confuse peptide bonds with hydrogen bonds. Peptide bonds are covalent bonds formed by condensation; hydrogen bonds are weaker intermolecular forces.
8. B — The enzyme's active site becomes denatured due to disruption of ionic bonds and hydrogen bonds, altering the tertiary structure. [1]
- Explanation: At pH 3.0 (highly acidic), the excess H+ ions disrupt the ionic bonds and hydrogen bonds that maintain the enzyme's tertiary structure. This causes the active site to lose its specific shape (denaturation), so the substrate can no longer bind effectively. The enzyme is not hydrolysed into amino acids under these conditions — that would require prolonged exposure to extreme conditions or protease activity.
- Common mistake: Students may think the substrate concentration changes with pH. While pH can affect substrate ionisation, the primary effect is on the enzyme's structure.
9. A — The primary structure determines the tertiary structure, which determines function. [1]
- Explanation: The primary structure (sequence of amino acids) determines how the polypeptide folds into its tertiary structure through interactions between R groups (hydrogen bonds, ionic bonds, disulfide bridges, hydrophobic interactions). The tertiary structure creates the specific 3D shape of the protein, including the active site in enzymes, which determines its function. Quaternary structure applies only to proteins with multiple polypeptide chains.
- Teaching note: This is a fundamental concept: sequence → structure → function. Students should be able to trace how a change in primary structure can alter function.
10. B — Competitive inhibition, because Vmax is unchanged and the apparent Km increases. [1]
- Explanation: In competitive inhibition, the inhibitor competes with the substrate for the active site. At sufficiently high substrate concentration, the substrate can outcompete the inhibitor, so Vmax remains unchanged. However, a higher substrate concentration is needed to reach half Vmax, so the apparent Km increases. This is the hallmark of competitive inhibition.
- Common mistake: Students may confuse competitive and non-competitive inhibition. Key distinction: competitive inhibition does not change Vmax; non-competitive inhibition reduces Vmax.
- Image note: The graph should show both curves reaching the same Vmax (100 arbitrary units), with Curve B requiring a higher substrate concentration to reach half Vmax, indicating a higher apparent Km.
Section B: Structured Questions [20 marks]
11.
(a) [2]
- A: Nucleus [1]
- C: Golgi apparatus [1]
- Marking: 1 mark each for correct identification.
(b) [1]
- Function of rough endoplasmic reticulum (B): Synthesis of proteins (for secretion, membrane incorporation, or lysosomes) / folding and transport of proteins. [1]
- Acceptable answers: Protein synthesis (ribosomes on RER); transport of proteins; folding of polypeptides.
- Not acceptable: "Protein synthesis and transport" without reference to the rough/studded nature — the question asks specifically about B (RER).
(c) [2]
- Explanation: The mitochondrion is called the "powerhouse of the cell" because it is the site of aerobic cellular respiration, where ATP is produced. [1] Specifically, the Krebs cycle occurs in the mitochondrial matrix and oxidative phosphorylation (electron transport chain and chemiosmosis) occurs across the inner mitochondrial membrane (cristae), producing the majority of the cell's ATP. [1]
- Marking: 1 mark for linking mitochondrion to ATP production; 1 mark for detail of aerobic respiration processes (Krebs cycle / electron transport chain / oxidative phosphorylation / chemiosmosis).
- Common mistake: Students may simply state "mitochondria produce energy" without specifying ATP or the processes involved. At A-Level, specific biochemical detail is expected.
(d) [2]
- Role of lysosome (E): Lysosomes contain hydrolytic (digestive) enzymes. [1] They digest worn-out organelles, engulfed pathogens, or food particles through autophagy and phagocytosis, recycling the molecular components back into the cytoplasm. [1]
- Marking: 1 mark for stating lysosomes contain hydrolytic enzymes; 1 mark for describing their digestive/recycling function.
- Acceptable: Reference to autophagy, phagocytosis, digestion of pathogens, or digestion of worn-out organelles.
- Common mistake: Students may confuse lysosomes with peroxisomes or describe them only as "suicide bags" without explaining the enzymatic mechanism.
12.
(a) [1]
- Phosphoester bond [1] (also accept "phosphodiester bond" in the context of the backbone, but for a single nucleotide, phosphoester is more precise).
- Explanation: The bond between the phosphate group and the 5' carbon of the deoxyribose sugar is a phosphoester bond (a type of covalent bond).
(b) [1]
- Phosphodiester bond [1]
- Explanation: Adjacent nucleotides are linked by phosphodiester bonds between the 3' carbon of one deoxyribose and the 5' phosphate of the next nucleotide, forming the sugar-phosphate backbone.
(c) [3]
- Explanation:
- The sequence of nitrogenous bases along the DNA strand encodes genetic information. [1]
- There are four different bases (adenine, thymine, guanine, cytosine), and their specific order determines the amino acid sequence of proteins. [1]
- The double-stranded structure with complementary base pairing (A-T, G-C) allows accurate replication and transcription, ensuring genetic information is faithfully copied and expressed. [1]
- Marking: 1 mark for base sequence encoding information; 1 mark for four bases determining amino acid sequence; 1 mark for complementary base pairing enabling accurate replication/transcription.
- Common mistake: Students may describe the structure of DNA without explaining how it carries information. The key concept is that the base sequence is the information.
(d) [2]
- Explanation:
- Complementary base pairing ensures that each strand of DNA serves as a template for the synthesis of a new complementary strand during replication. [1]
- Adenine always pairs with thymine (via two hydrogen bonds) and guanine always pairs with cytosine (via three hydrogen bonds), so the new strand is an exact complement of the template strand, ensuring the genetic information is copied accurately. [1]
- Marking: 1 mark for template strand concept; 1 mark for specific base pairing rules and accuracy.
- Teaching note: Students should understand that the specificity of base pairing is the molecular basis for the fidelity of DNA replication.
13.
(a) [2]
- Description of trend:
- As temperature increases from 10 °C to 40 °C, the volume of oxygen produced increases (from 2.1 to 12.3 cm³). [1]
- As temperature increases above 40 °C, the volume of oxygen produced decreases sharply (from 12.3 to 0.4 cm³ at 70 °C). [1]
- Marking: 1 mark for describing the increase up to 40 °C; 1 mark for describing the decrease above 40 °C. Both parts must include reference to data or directional change.
- Common mistake: Students may describe only one part of the trend. The full trend includes both the increase and the decrease.
(b) [3]
- Explanation:
- At temperatures above 40 °C, the enzyme catalase begins to denature. [1]
- The high kinetic energy disrupts the hydrogen bonds, ionic bonds, and other non-covalent interactions that maintain the enzyme's tertiary structure. [1]
- This alters the shape of the active site, so the substrate (H2O2) can no longer bind effectively, reducing the rate of reaction and the volume of oxygen produced. [1]
- Marking: 1 mark for stating denaturation occurs; 1 mark for explaining disruption of bonds/tertiary structure; 1 mark for linking altered active site to reduced substrate binding/reaction rate.
- Common mistake: Students may state that the enzyme is "killed" — enzymes are not living and cannot be killed; they are denatured. Also, students should not say the substrate is destroyed — the enzyme is affected, not the substrate.
(c) [1]
- Explanation: Using potato cubes of equal size ensures that the amount of enzyme (catalase) present is the same in each test, so that the only variable affecting the rate of reaction is temperature. [1] This is a controlled variable / ensures a fair test.
- Acceptable: "To ensure the same amount of enzyme is present" / "To control the variable of enzyme concentration" / "To ensure a fair test."
(d) [1]
- Any one of the following: [1]
- Concentration of hydrogen peroxide solution
- Volume of hydrogen peroxide solution
- pH of the solution
- Not acceptable: "Temperature" (this is the independent variable being tested) or "size of potato cube" (already stated in the question).
14.
(a) [2]
- X: Cholesterol [1]
- Y: Glycoprotein [1]
- Marking: 1 mark each for correct identification.
(b) [2]
- Explanation:
- "Fluid" refers to the fact that the phospholipids and proteins can move laterally within the bilayer, giving the membrane flexibility and dynamic properties. [1]
- "Mosaic" refers to the variety of proteins, cholesterol, glycoproteins, and glycolipids embedded in or attached to the phospholipid bilayer, creating a patchwork appearance. [1]
- Marking: 1 mark for explaining "fluid"; 1 mark for explaining "mosaic."
- Common mistake: Students may describe the model without explaining the terms. Both terms must be addressed.
(c) [2]
- Role of cholesterol:
- Cholesterol is located between the phospholipid tails in the hydrophobic region of the bilayer. [1]
- It regulates membrane fluidity: at high temperatures, it restricts phospholipid movement, reducing fluidity; at low temperatures, it prevents tight packing of phospholipids, maintaining fluidity. It also helps maintain mechanical stability and reduces permeability to small polar molecules. [1]
- Marking: 1 mark for location between phospholipid tails; 1 mark for describing its role in regulating fluidity/stability.
- Common mistake: Students may state only one function of cholesterol. At A-Level, the dual role in fluidity regulation is expected.
(d) [2]
- Explanation:
- The carbohydrate chain (oligosaccharide) of the glycoprotein extends from the extracellular surface of the membrane. [1]
- The specific shape and chemical properties of the carbohydrate chain allow it to act as a recognition site / binding site for specific signalling molecules (e.g., hormones, neurotransmitters), enabling cell-cell recognition and signal transduction. [1]
- Marking: 1 mark for describing the carbohydrate chain on the extracellular surface; 1 mark for explaining its role in molecular recognition/signal binding.
- Acceptable: Reference to cell-cell recognition, signal transduction, or receptor function.
15.
(a) [1]
- General formula: A central carbon atom bonded to an amino group (–NH₂), a carboxyl group (–COOH), a hydrogen atom (–H), and a variable R group. [1]
- Acceptable: A diagram showing the general structure, or a written description that includes all four components bonded to a central carbon.
(b) [2]
- Reaction: Condensation reaction (or dehydration synthesis) [1]
- Bond formed: Peptide bond [1]
- Explanation: Two amino acids join when the carboxyl group of one reacts with the amino group of another, releasing a water molecule and forming a peptide bond (–CO–NH–).
(c) [3]
- Explanation:
- The R group (side chain) varies between different amino acids and can be hydrophobic, hydrophilic, polar, charged (positive or negative), or contain special groups (e.g., cysteine's –SH). [1]
- During protein folding, R groups interact with each other through hydrogen bonds, ionic bonds, disulfide bonds (between cysteine residues), and hydrophobic interactions. [1]
- These interactions determine the final 3D shape (tertiary structure) of the protein, which is essential for its biological function (e.g., the shape of an enzyme's active site). [1]
- Marking: 1 mark for describing the variety of R groups; 1 mark for naming the types of bonds/interactions between R groups; 1 mark for linking tertiary structure to function.
- Common mistake: Students may list types of bonds without explaining how they contribute to the 3D shape. The key is to connect R group interactions to the folding of the protein.
(d) [2]
- Prediction:
- Aspartic acid, with its negatively charged (hydrophilic) R group, would be found on the outer surface of the globular protein. [1]
- This is because hydrophilic R groups interact favourably with the surrounding aqueous environment (water molecules), so they tend to be positioned on the exterior of the protein, while hydrophobic R groups are buried in the interior. [1]
- Marking: 1 mark for predicting surface/exterior position; 1 mark for explaining the interaction with the aqueous environment.
- Teaching note: This is a fundamental principle of protein folding: hydrophobic R groups are buried inside, hydrophilic R groups face outward toward water.
Section C: Free Response [20 marks]
16.
(a) [1]
- Transcription occurs in the nucleus. [1]
(b) [2]
- Role of tRNA in translation:
- Each tRNA molecule carries a specific amino acid to the ribosome. [1]
- The anticodon on the tRNA base-pairs with the complementary codon on the mRNA, ensuring the correct amino acid is added to the growing polypeptide chain. [1]
- Marking: 1 mark for carrying amino acids; 1 mark for anticodon-codon pairing ensuring correct sequence.
- Common mistake: Students may describe tRNA without mentioning the anticodon-codon interaction, which is the key mechanism for accurate translation.
(c) [3]
- Explanation:
- mRNA is a single-stranded molecule that carries the genetic code from DNA in the nucleus to ribosomes in the cytoplasm. [1]
- The sequence of codons (triplets of nucleotides) on the mRNA corresponds to the amino acid sequence of the protein, as determined by the genetic code. [1]
- mRNA is small enough to pass through nuclear pores from the nucleus to the cytoplasm, and its 5' cap and poly-A tail protect it from degradation and facilitate ribosome binding. [1]
- Marking: 1 mark for mRNA carrying genetic code from nucleus; 1 mark for codons specifying amino acid sequence; 1 mark for mRNA structure enabling transport/stability (nuclear pores, 5' cap, poly-A tail).
- Common mistake: Students may describe mRNA structure without explaining how it enables transport from nucleus to cytoplasm.
(d) [4]
- Comparison of transcription and translation:
| Feature | Transcription | Translation |
|---|---|---|
| Location | Nucleus [1] | Cytoplasm (at ribosomes) [1] |
| Template | DNA (template strand) | mRNA |
| Product | mRNA | Polypeptide/protein |
| Enzyme/ machinery | RNA polymerase | Ribosome, tRNA |
| Building blocks | RNA nucleotides | Amino acids |
| Key process | Complementary base pairing (A-U, T-A, G-C) | Codon-anticodon pairing |
- Similarities: Both involve complementary base pairing; both are stages of gene expression; both require specific enzymes/machinery; both use nucleic acid templates. [1]
- Differences: Different locations, different templates, different products, different building blocks. [1]
- Marking: 1 mark for location of transcription; 1 mark for location of translation; 1 mark for stating similarities; 1 mark for stating differences. Answers should be presented as a coherent comparison, not just a table.
- Common mistake: Students may describe each process separately without explicitly comparing and contrasting them. The question requires both comparison (similarities) and contrast (differences).
17.
(a) [3]
- Sample P: Starch and lipid [1]
- (Blue-black with iodine = starch; cloudy white emulsion with ethanol = lipid)
- Sample Q: Reducing sugar and starch [1]
- (Brick-red precipitate with Benedict's = reducing sugar; blue-black with iodine = starch)
- Sample R: Protein [1]
- (Violet/purple with Biuret = protein; negative for all other tests)
- Marking: 1 mark per sample for correct identification of all present molecules.
(b) [2]
- Ethanol emulsion test procedure:
- Add ethanol (or ethanol and water) to the food sample and shake thoroughly to dissolve any lipids. [1]
- Pour the ethanol mixture into a test tube containing water (or add water). A cloudy white emulsion indicates the presence of lipids. [1]
- Marking: 1 mark for dissolving sample in ethanol; 1 mark for adding water and observing cloudy white emulsion.
- Common mistake: Students may forget the step of adding water after dissolving in ethanol. The emulsion forms when the lipid-ethanol solution is diluted with water.
(c) [2]
- Explanation:
- Benedict's test detects reducing sugars, which have a free aldehyde or ketone group that can reduce Cu2+ (in Benedict's solution) to Cu+. [1]
- Non-reducing sugars (such as sucrose) do not have a free aldehyde or ketone group (both anomeric carbons are involved in the glycosidic bond), so they cannot reduce Benedict's reagent and do not give a positive result. [1]
- Marking: 1 mark for explaining reducing sugars have free aldehyde/ketone groups; 1 mark for explaining non-reducing sugars lack these groups.
- Common mistake: Students may not understand why sucrose is a non-reducing sugar. The key is that both anomeric carbons are bonded in the glycosidic linkage.
(d) [3]
- Testing for sucrose:
- First, perform Benedict's test on sample Q — if it is already positive for reducing sugar, hydrolyse the sample first by heating with dilute hydrochloric acid (HCl). [1]
- Neutralise the acid with sodium hydrogadd carbonate (NaHCO3). [1]
- Then perform Benedict's test again. If a brick-red precipitate is now obtained (stronger than before), this confirms the presence of sucrose, as hydrolysis of sucrose produces glucose and fructose (both reducing sugars). [1]
- Marking: 1 mark for heating with dilute HCl (hydrolysis); 1 mark for neutralising with NaHCO3; 1 mark for retesting with Benedict's and interpreting the result.
- Common mistake: Students may forget the neutralisation step. Benedict's test requires alkaline conditions, so the acid must be neutralised before retesting.
18.
(a) [3]
- Inhibitor X shows competitive inhibition. [1]
- Explanation: On the Lineweaver-Burk plot, Line B (inhibitor X) has the same y-intercept as Line A (no inhibitor), meaning Vmax is unchanged. [1] However, the x-intercept is different (further from the origin), meaning the apparent Km has increased. This is characteristic of competitive inhibition, where the inhibitor competes with the substrate for the active site. [1]
- Marking: 1 mark for identifying competitive inhibition; 1 mark for explaining unchanged Vmax (same y-intercept); 1 mark for explaining increased Km (different x-intercept).
- Common mistake: Students may identify the inhibition type correctly but fail to explain using the graph data. At A-Level, explanations must reference the figure.
(b) [3]
- Inhibitor Y shows non-competitive inhibition. [1]
- Explanation: On the Lineweaver-Burk plot, Line C (inhibitor Y) has the same x-intercept as Line A (no inhibitor), meaning Km is unchanged. [1] However, the y-intercept is higher, meaning Vmax is reduced. This is characteristic of non-competitive inhibition, where the inhibitor binds to a site other than the active site, reducing the enzyme's catalytic efficiency without affecting substrate binding. [1]
- Marking: 1 mark for identifying non-competitive inhibition; 1 mark for explaining unchanged Km (same x-intercept); 1 mark for explaining reduced Vmax (higher y-intercept).
(c) [2]
- Explanation:
- Competitive inhibition can be overcome by increasing the substrate concentration. [1]
- At high substrate concentrations, the substrate molecules outcompete the inhibitor for binding to the active site, so the enzyme can still reach its Vmax. [1]
- Marking: 1 mark for stating increased substrate concentration overcomes inhibition; 1 mark for explaining the competition mechanism.
(d) [2]
- Example: In the metabolic pathway converting isoleucine from threonine in bacteria, the end product (isoleucine) acts as an allosteric inhibitor of the first enzyme in the pathway (threonine deaminase). [1]
- Significance: Feedback inhibition prevents the over-accumulation of the end product, allowing the cell to regulate metabolic pathways efficiently and conserve resources (energy and raw materials). [1]
- Acceptable examples: ATP inhibiting phosphofructokinase in glycolysis; citrate inhibiting phosphofructokinase; any valid metabolic feedback inhibition example.
- Marking: 1 mark for a valid example; 1 mark for explaining the significance in metabolic regulation.
- Common mistake: Students may give an example without explaining the significance. Both parts are required.
19.
(a) [2]
- Any two of the following: [1 mark each]
- Prokaryotic cells lack a true nucleus (DNA is in the nucleoid region, not enclosed by a nuclear envelope), while eukaryotic cells have a membrane-bound nucleus.
- Prokaryotic cells lack membrane-bound organelles (e.g., mitochondria, ER, Golgi), while eukaryotic cells have membrane-bound organelles.
- Prokaryotic cells have 70S ribosomes, while eukaryotic cells have 80S ribosomes.
- Prokaryotic cells have a single circular chromosome, while eukaryotic cells have multiple linear chromosomes.
- Marking: 1 mark per valid difference, maximum 2 marks.
(b) [2]
- Explanation:
- Prokaryotic cells are generally smaller because they lack membrane-bound organelles and internal compartmentalisation, so all cellular processes occur in the cytoplasm or at the cell membrane. [1]
- Their smaller size gives them a larger surface area-to-volume ratio, which is more efficient for the exchange of materials (nutrients, waste) across the cell membrane by diffusion. [1]
- Marking: 1 mark for lack of organelles/compartmentalisation; 1 mark for surface area-to-volume ratio and efficiency of diffusion.
- Common mistake: Students may state that prokaryotes are smaller without explaining why. The explanation should link structure to function.
(c) [4]
(i) Cell wall: [2]
- The cell wall provides structural support and maintains the shape of the prokaryotic cell. [1] It prevents the cell from bursting (lysis) when water enters by osmosis in a hypotonic environment. [1]
- Acceptable: Reference to protection, maintaining shape, preventing osmotic lysis.
(ii) Plasmid: [2]
- Plasmids are small, circular, double-stranded DNA molecules that are separate from the chromosomal DNA. [1] They often carry genes that provide advantages such as antibiotic resistance, and can be transferred between bacteria (horizontal gene transfer via conjugation). [1]
- Marking: 1 mark for describing plasmid structure; 1 mark for function (antibiotic resistance, gene transfer).
- Common mistake: Students may confuse plasmids with the main chromosome. Plasmids are extra-chromosomal DNA.
(d) [2]
- Significance of compartmentalisation:
- Membrane-bound organelles in eukaryotic cells separate different metabolic processes, allowing incompatible reactions to occur simultaneously in different compartments. [1]
- This increases the efficiency of cellular processes by concentrating enzymes and substrates in specific locations (e.g., digestive enzymes in lysosomes, respiratory enzymes in mitochondria) and provides a larger surface area for membrane-bound reactions (e.g., cristae in mitochondria). [1]
- Marking: 1 mark for separating incompatible reactions; 1 mark for increasing efficiency through concentration of enzymes/substrates or increased surface area.
- Common mistake: Students may state that compartmentalisation "separates processes" without explaining the functional advantage.
20.
(a) [3]
- Three principles of cell theory: [1 mark each]
- All living organisms are composed of one or more cells.
- The cell is the basic unit of life / the basic unit of structure and function in living organisms.
- All cells arise from pre-existing cells (Omnis cellula e cellula).
- Marking: 1 mark per correct principle.
(b) [2]
- Explanation:
- The electron microscope uses a beam of electrons instead of light, which has a much shorter wavelength, allowing much higher resolution (nanometre scale) than light microscopes. [1]
- This allowed scientists to observe the internal ultrastructure of cells in detail, including organelles such as the endoplasmic reticulum, ribosomes, and the detailed structure of membranes, which could not be resolved with light microscopes. [1]
- Marking: 1 mark for higher resolution due to shorter wavelength of electrons; 1 mark for observing internal ultrastructure of organelles.
- Common mistake: Students may state that electron microscopes "magnify more" without explaining the resolution advantage. Resolution (ability to distinguish two separate points) is more important than magnification.
(c) [1]
- One key difference: TEM produces detailed 2D images of internal cell structures by transmitting electrons through a thin specimen, while SEM produces 3D images of cell surfaces by scanning electrons across the surface. [1]
- Acceptable: Any valid difference between TEM and SEM (e.g., TEM = internal structure, SEM = surface; TEM = 2D, SEM = 3D; TEM requires thin sections, SEM does not).
(d) [4]
- Meaning of "amphipathic":
- Amphipathic means having both hydrophilic (water-loving) and hydrophobic (water-fearing) regions within the same molecule. [1]
- In phospholipids, the phosphate head is hydrophilic (polar) and the two fatty acid tails are hydrophobic (non-polar). [1]
- Importance for membrane formation:
- When phospholipids are placed in an aqueous environment, the hydrophobic effect causes the hydrophobic tails to orient away from water, while the hydrophilic heads interact with water. [1]
- This drives the spontaneous formation of a phospholipid bilayer, with heads facing the aqueous environment on both sides and tails facing each other in the interior. This bilayer is the fundamental structure of all biological membranes, providing a stable barrier that separates the cell contents from the external environment. [1]
- Marking: 1 mark for defining amphipathic; 1 mark for describing the hydrophilic head and hydrophobic tails of phospholipids; 1 mark for explaining the hydrophobic effect driving bilayer formation; 1 mark for linking bilayer formation to membrane function as a barrier.
- Common mistake: Students may describe the structure of phospholipids without explaining the spontaneous self-assembly process driven by the hydrophobic effect. The key concept is that bilayer formation is energetically favourable and occurs spontaneously.
Total: 50 marks
Mark Distribution Summary:
| Section | Marks |
|---|---|
| Section A (Q1–10) | 10 |
| Section B (Q11–15) | 20 |
| Section C (Q16–20) | 20 |
| Total | 50 |
Free quiz and exam paper access
Enter your details to view this paper
Your access is remembered on this device.