From Real Exams Exam Paper
A Level H2 Biology Practice Paper 1
Free A Level H2 Biology Practice Paper 1, LongCat Exam version, with questions, answers, and A Level-style practice for Singapore students.
These static practice materials are generated from the site's syllabus and paper-generation workflow, with source and model context shown so students and parents can evaluate the material before use.
Questions
TuitionGoWhere Practice Paper - Biology H2 A-Level
TuitionGoWhere Secondary School (AI)
| Field | Details |
|---|---|
| Subject: | Biology (H2) |
| Level: | A-Level |
| Paper: | Practice Paper — Cells & Biomolecules |
| Version: | 1 of 5 |
| Duration: | 60 minutes |
| Total Marks: | 60 |
| Name: | |
| Class: | |
| Date: |
Instructions to Candidates
- Write your name, class, and date in the spaces provided above.
- Answer ALL questions in the spaces provided.
- Write in dark blue or black pen.
- You may use a pencil for any diagrams or graphs.
- Do not use correction fluid.
- The total marks for this paper is 60.
- The number of marks for each question or part question is shown in brackets [ ].
- You are advised to spend no more than 60 minutes on this paper.
Section A: Short-Answer Questions (20 marks)
Answer ALL questions 1–8 in the spaces provided.
1. State two structural differences between a prokaryotic cell and a eukaryotic cell.
.......................................................................................................................
.......................................................................................................................
.......................................................................................................................
.......................................................................................................................
[2]
2. Table 1 below shows the results of a food test carried out on four unknown solutions (P, Q, R, and S).
| Solution | Benedict's test (after boiling) | Iodine test | Biuret test | Ethanol emulsion test |
|---|---|---|---|---|
| P | Orange precipitate | Brown | Pale blue | Cloudy white |
| Q | Blue | Blue-black | Pale blue | Clear |
| R | Blue | Brown | Purple | Clear |
| S | Orange precipitate | Brown | Pale blue | Clear |
Table 1
(a) Which solution(s) contain(s) reducing sugars? Explain your answer.
.......................................................................................................................
.......................................................................................................................
[1]
(b) Which solution contains starch? Explain your answer.
......................................................................................................................
.......................................................................................................................
[1]
(c) Which solution contains protein but no lipid?
.......................................................................................................................
.......................................................................................................................
[1]
3. Describe the structure of a phospholipid molecule and explain how phospholipids arrange themselves in an aqueous environment.
.......................................................................................................................
.......................................................................................................................
.......................................................................................................................
.......................................................................................................................
.......................................................................................................................
.......................................................................................................................
[3]
4. Explain what is meant by the term complementary base pairing in DNA. State the specific base pairs and the number of hydrogen bonds between each pair.
.......................................................................................................................
.......................................................................................................................
.......................................................................................................................
.......................................................................................................................
.......................................................................................................................
[3]
5. Distinguish between condensation and hydrolysis reactions in the context of biological molecules. Give one example of each.
.......................................................................................................................
.......................................................................................................................
.......................................................................................................................
.......................................................................................................................
.......................................................................................................................
.......................................................................................................................
[3]
6. A student carried out an experiment to investigate the effect of temperature on the activity of enzyme catalase on hydrogen peroxide. The volume of oxygen gas collected in 2 minutes at each temperature is shown in Table 2.
| Temperature / °C | Volume of O₂ collected in 2 min / cm³ |
|---|---|
| 10 | 4 |
| 20 | 12 |
| 30 | 28 |
| 40 | 42 |
| 50 | 38 |
| 60 | 8 |
| 70 | 2 |
Table 2
(a) Describe the trend shown in Table 2.
.......................................................................................................................
.......................................................................................................................
.......................................................................................................................
[2]
(b) Explain the decrease in enzyme activity at temperatures above 40 °C.
.......................................................................................................................
.......................................................................................................................
.......................................................................................................................
.......................................................................................................................
[2]
7. Name the type of bond that links:
(a) Adjacent amino acids in a polypeptide chain.
.......................................................................................................................
[1]
(b) Complementary nitrogenous bases in DNA.
.......................................................................................................................
[1]
8. State two functions of proteins in living organisms and give one named example for each function.
.......................................................................................................................
.......................................................................................................................
.......................................................................................................................
.......................................................................................................................
[2]
Section B: Structured Questions (25 marks)
Answer ALL questions 9–12 in the spaces provided.
9. Figure 1 shows the structure of a typical animal cell as seen under an electron microscope.
Image pending generation: diagram for Q9.
Figure 1
(a) Identify the organelles labelled A to F in Figure 1.
A: .......................................................
B: .......................................................
C: .......................................................
D: .......................................................
E: .......................................................
F: .......................................................
[3]
(b) Describe the role of the organelle labelled B in the secretion of proteins.
.......................................................................................................................
.......................................................................................................................
.......................................................................................................................
.......................................................................................................................
[2]
(c) Explain why organelle C is found in large numbers in cells that are highly metabolically active, such as muscle cells.
.......................................................................................................................
.......................................................................................................................
.......................................................................................................................
.......................................................................................................................
[2]
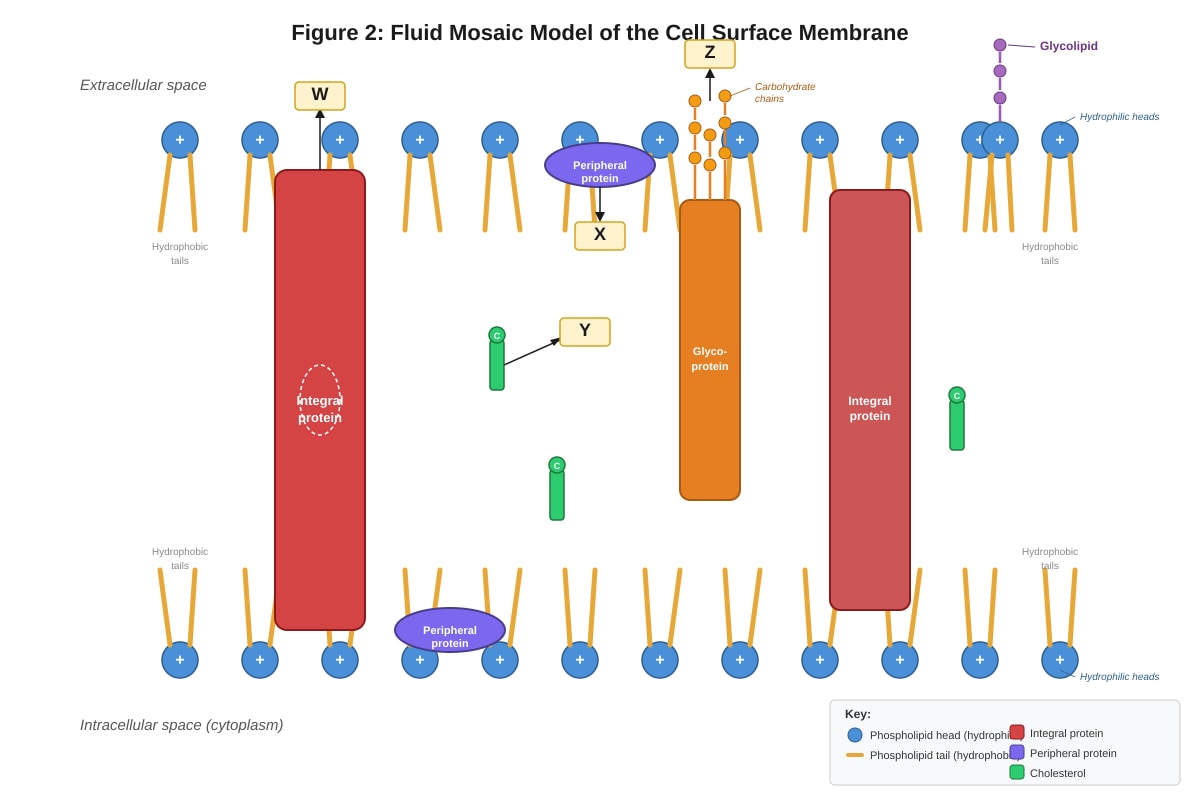
10. Figure 2 shows a section through a cell surface membrane.
Generated diagram for Q10.
Figure 2
(a) Identify the components labelled W, X, Y, and Z in Figure 2.
W: .......................................................
X: .......................................................
Y: .......................................................
Z: .......................................................
[2]
(b) With reference to Figure 2, explain how the structure of the phospholipid bilayer provides a barrier to the movement of ions and polar molecules across the membrane.
.......................................................................................................................
.......................................................................................................................
.......................................................................................................................
.......................................................................................................................
.......................................................................................................................
[3]
(c) Explain the role of cholesterol in the cell surface membrane.
.......................................................................................................................
.......................................................................................................................
.......................................................................................................................
[2]
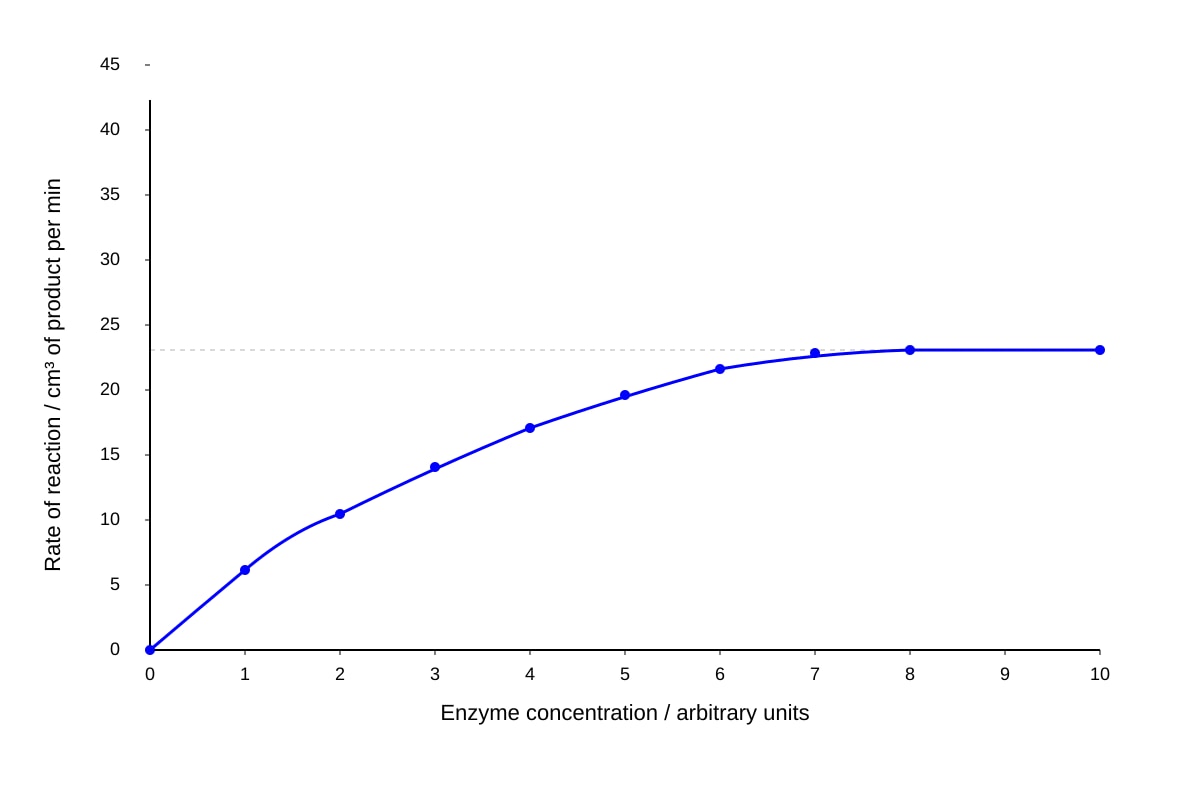
11. An experiment was carried out to investigate the effect of enzyme concentration on the rate of reaction. A fixed concentration of substrate was used at 37 °C and pH 7. The results are shown in Figure 3.
Generated graph for Q11.
Figure 3
(a) Describe the relationship between enzyme concentration and rate of reaction as shown in Figure 3.
.......................................................................................................................
.......................................................................................................................
.......................................................................................................................
[2]
(b) Explain why the rate of reaction plateaus at high enzyme concentrations.
.......................................................................................................................
.......................................................................................................................
.......................................................................................................................
.......................................................................................................................
[2]
(c) Sketch on the axes of Figure 3 the curve you would expect if the experiment were repeated with a lower fixed concentration of substrate. Label this curve "X".
[1]
(d) Explain the shape of curve X that you have drawn.
.......................................................................................................................
.......................................................................................................................
.......................................................................................................................
[2]
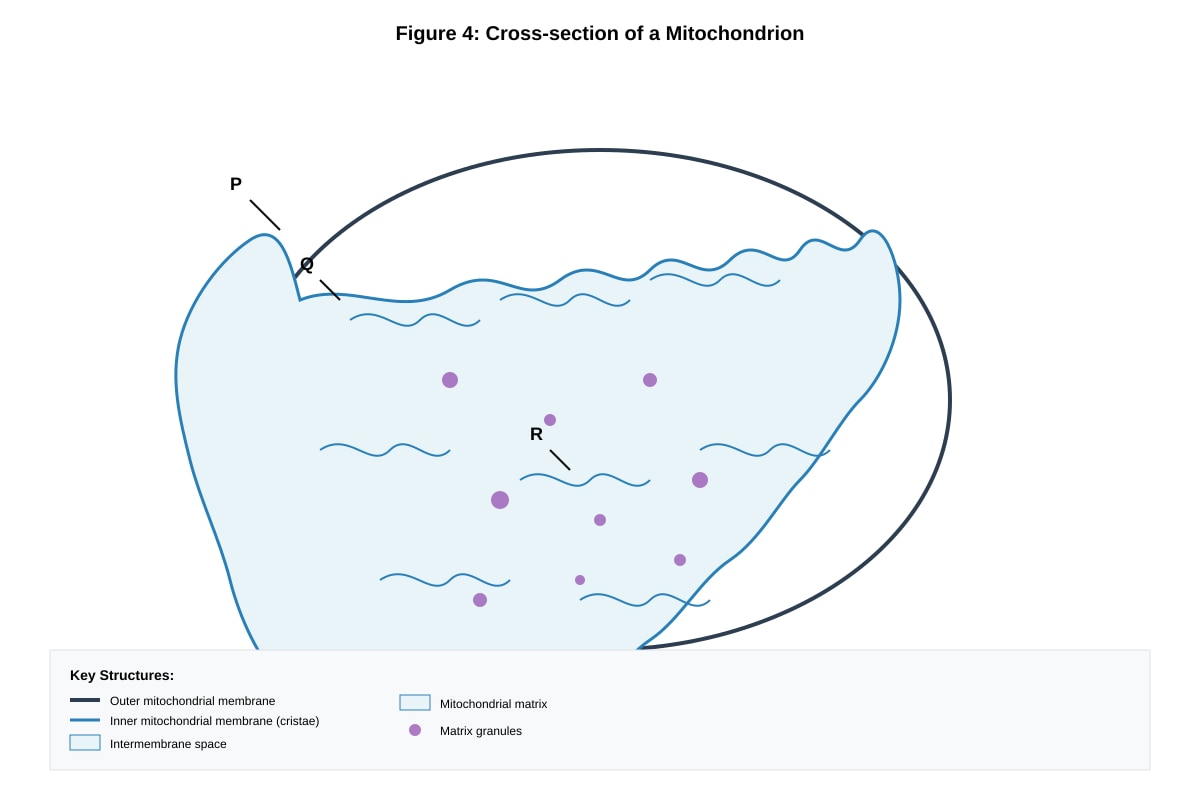
12. Figure 4 shows a simplified diagram of a section through a mitochondrion.
Generated diagram for Q12.
Figure 4
(a) Identify the regions labelled P, Q, and R in Figure 4.
P: .......................................................
Q: .......................................................
R: .......................................................
[2]
(b) Explain why the inner mitochondrial membrane is highly folded into cristae.
.......................................................................................................................
.......................................................................................................................
.......................................................................................................................
.......................................................................................................................
[2]
(c) Name one stage of aerobic respiration that occurs in region R and state what is produced during this stage.
.......................................................................................................................
.......................................................................................................................
[2]
Section C: Data-Based and Extended Response Questions (15 marks)
Answer ALL questions 13–14 in the spaces provided.
13. Read the following passage and answer the questions that follow.
Prion diseases are a group of neurodegenerative disorders caused by the misfolding of the normal cellular prion protein (PrP^C) into an abnormal, disease-causing isoform (PrP^Sc). PrP^C is a glycoprotein found on the surface of neurons and has a predominantly alpha-helical secondary structure. In contrast, PrP^Sc has a high proportion of beta-sheet structure. This conformational change makes PrP^Sc resistant to protease digestion and causes it to aggregate, forming insoluble fibrils that accumulate in brain tissue.
Unlike viruses and bacteria, prions do not contain nucleic acids. The misfolded PrP^Sc acts as a template, inducing the misfolding of normal PrP^C molecules upon contact. This sets up a chain reaction that leads to an exponential increase in the amount of PrP^Sc. The accumulation of these protein aggregates leads to neuronal cell death, spongiform degeneration of the brain, and ultimately fatal disease.
The gene encoding PrP^C is found on chromosome 20 in humans. Mutations in this gene can predispose the prion protein to misfolding, leading to inherited prion diseases such as familial Creutzfeldt-Jakob disease (fCJD).
(a) With reference to the passage, describe the structural difference between PrP^C and PrP^Sc.
.......................................................................................................................
.......................................................................................................................
.......................................................................................................................
[2]
(b) Explain why PrP^Sc is resistant to protease digestion.
.......................................................................................................................
.......................................................................................................................
.......................................................................................................................
[2]
(c) Explain how prion diseases can spread within an individual even though prions do not contain nucleic acids.
.......................................................................................................................
.......................................................................................................................
.......................................................................................................................
.......................................................................................................................
[3]
(d) Suggest why a mutation in the gene encoding PrP^C could lead to an increased likelihood of the protein misfolding.
.......................................................................................................................
.......................................................................................................................
.......................................................................................................................
.......................................................................................................................
[2]
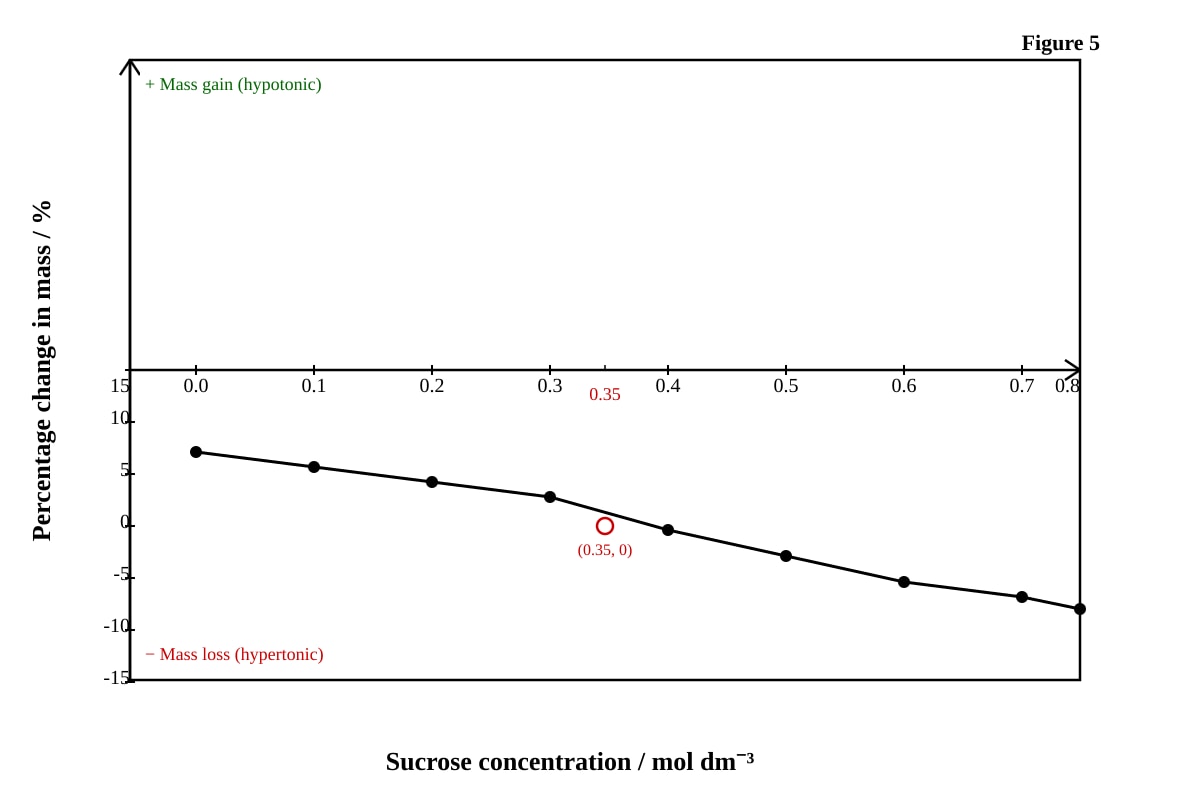
14. Figure 5 shows the results of an experiment in which plant cells were placed in solutions of different sucrose concentrations and the percentage change in mass of the cells was measured after 30 minutes.
Generated graph for Q14.
Figure 5
(a) Describe the relationship between sucrose concentration and the percentage change in mass of the plant cells.
.......................................................................................................................
.......................................................................................................................
.......................................................................................................................
[2]
(b) Estimate the sucrose concentration at which there is no net movement of water into or out of the cells. Explain your reasoning.
.......................................................................................................................
.......................................................................................................................
.......................................................................................................................
[2]
(c) Explain, in terms of water potential, why the plant cells placed in 0.6 mol dm⁻³ sucrose solution showed a decrease in mass.
.......................................................................................................................
.......................................................................................................................
.......................................................................................................................
.......................................................................................................................
[3]
(d) A student suggested that the cell wall prevents the plant cell from bursting in a hypotonic solution. Evaluate this statement with reference to the structure and properties of the cell wall.
.......................................................................................................................
.......................................................................................................................
.......................................................................................................................
.......................................................................................................................
.......................................................................................................................
[3]
End of Paper
Total: 60 marks
Answers
TuitionGoWhere Practice Paper - Biology H2 A-Level
Answer Key — Cells & Biomolecules (Version 1 of 5)
Section A: Short-Answer Questions
1. State two structural differences between a prokaryotic cell and a eukaryotic cell. [2]
Answer:
- Prokaryotic cells do not have a membrane-bound nucleus (DNA is free in the cytoplasm/nucleoid region), whereas eukaryotic cells do have a membrane-bound nucleus.
- Prokaryotic cells do not have membrane-bound organelles (e.g., mitochondria, endoplasmic reticulum), whereas eukaryotic cells do have membrane-bound organelles.
Marking notes:
- 1 mark per valid structural difference. Accept any two from: absence of nuclear envelope, absence of membrane-bound organelles, presence of 70S ribosomes (vs 80S), circular DNA (vs linear chromosomes), cell wall made of murein/peptidoglycan (in bacteria), smaller cell size.
- Do not accept "prokaryotes are smaller" alone without a structural reference — size is a general feature, not a structural difference per se, though it may be accepted at teacher discretion.
2. (a) Which solution(s) contain(s) reducing sugars? Explain your answer. [1]
Answer:
- Solution P and Solution S contain reducing sugars.
- Explanation: Benedict's test produces an orange precipitate in the presence of reducing sugars. Both P and S give an orange precipitate with Benedict's test (after boiling), indicating the presence of reducing sugars such as glucose, maltose, or fructose.
Teaching note: Benedict's reagent (copper(II) sulfate in alkaline solution) is reduced by reducing sugars. The colour change is blue → green → yellow → orange → brick red, depending on the concentration of reducing sugar. An orange precipitate indicates a moderate concentration of reducing sugar.
2. (b) Which solution contains starch? Explain your answer. [1]
Answer:
- Solution Q contains starch.
- Explanation: The iodine test turns blue-black in the presence of starch. Only solution Q gives a blue-black colour with iodine solution.
Teaching note: Iodine (in potassium iodide solution) interacts with the helical structure of amylose in starch to produce the characteristic blue-black colour. A brown/yellow colour indicates the absence of starch.
2. (c) Which solution contains protein but no lipid? [1]
Answer:
- Solution R contains protein but no lipid.
- Explanation: Solution R gives a purple colour with Biuret test (indicating protein) and remains clear with the ethanol emulsion test (indicating no lipid).
Teaching note: The Biuret test detects peptide bonds. Copper(II) ions in an alkaline solution form a violet/purple complex with peptide bonds. The ethanol emulsion test: lipids dissolve in ethanol and when the ethanol solution is poured into water, a cloudy white emulsion forms as the lipid comes out of solution.
3. Describe the structure of a phospholipid molecule and explain how phospholipids arrange themselves in an aqueous environment. [3]
Answer:
- A phospholipid molecule consists of a glycerol backbone, two fatty acid hydrocarbon chains (hydrophobic tails), and a phosphate group (hydrophilic head) which is often linked to a polar/charged group (e.g., choline).
- In an aqueous environment, phospholipids spontaneously arrange themselves into a bilayer: the hydrophilic phosphate heads face outwards towards the water, and the hydrophobic fatty acid tails face inwards, away from the water.
- This arrangement is driven by the hydrophobic effect — the nonpolar tails are repelled by water and cluster together, while the polar heads interact favourably with water molecules.
Marking scheme:
- 1 mark: correct description of phospholipid structure (glycerol + 2 fatty acids + phosphate head).
- 1 mark: correct description of bilayer arrangement (heads outward, tails inward).
- 1 mark: correct explanation referencing hydrophobic/hydrophilic interactions or the hydrophobic effect.
4. Explain what is meant by the term complementary base pairing in DNA. State the specific base pairs and the number of hydrogen bonds between each pair. [3]
Answer:
- Complementary base pairing refers to the specific pairing of nitrogenous bases in DNA through hydrogen bonds, where each base on one strand pairs with a specific partner on the opposite strand.
- Adenine (A) pairs with Thymine (T) via 2 hydrogen bonds.
- Guanine (G) pairs with Cytosine (C) via 3 hydrogen bonds.
Marking scheme:
- 1 mark: definition of complementary base pairing (specific H-bonded pairing between bases on opposite strands).
- 1 mark: A=T (2 H-bonds) correctly stated.
- 1 mark: G≡C (3 H-bonds) correctly stated.
Common mistake: Students may confuse DNA base pairing with RNA base pairing (where Uracil replaces Thymine). Ensure the answer specifies DNA.
5. Distinguish between condensation and hydrolysis reactions in the context of biological molecules. Give one example of each. [3]
Answer:
- Condensation is a reaction in which two molecules are joined together with the removal of a water molecule (specifically, –OH from one molecule and –H from another). Example: formation of a peptide bond between two amino acids to form a dipeptide.
- Hydrolysis is a reaction in which a molecule is split into smaller units by the addition of a water molecule. Example: the breakdown of a disaccharide (e.g., sucrose) into its constituent monosaccharides (glucose and fructose).
Marking scheme:
- 1 mark: correct definition of condensation (joining + removal of water).
- 1 mark: correct definition of hydrolysis (breaking apart + addition of water).
- 1 mark: one valid example for each (any appropriate biological example accepted).
Teaching note: Condensation builds polymers from monomers; hydrolysis breaks polymers into monomers. These are reverse reactions of each other.
6. (a) Describe the trend shown in Table 2. [2]
Answer:
- As temperature increases from 10 °C to 40 °C, the volume of O₂ collected increases (from 4 cm³ to 42 cm³), indicating that enzyme activity increases with temperature.
- As temperature increases above 40 °C to 70 °C, the volume of O₂ collected decreases sharply (from 42 cm³ to 2 cm³), indicating that enzyme activity decreases at higher temperatures.
- The optimum temperature for catalase activity is approximately 40 °C.
Marking scheme:
- 1 mark: describes the increase in activity from 10 °C to 40 °C.
- 1 mark: describes the decrease in activity above 40 °C (or identifies 40 °C as the optimum).
6. (b) Explain the decrease in enzyme activity at temperatures above 40 °C. [2]
Answer:
- At temperatures above 40 °C, the enzyme molecules gain excessive kinetic energy, which disrupts the hydrogen bonds and other weak intermolecular forces (e.g., hydrophobic interactions, ionic bonds) that maintain the enzyme's tertiary (3D) structure.
- This causes the enzyme to denature — the active site changes shape so that the substrate can no longer bind effectively (lock-and-key or induced fit no longer works), and the rate of reaction decreases.
Marking scheme:
- 1 mark: reference to disruption of hydrogen bonds / weak bonds / tertiary structure.
- 1 mark: reference to denaturation and change in active site shape / loss of enzyme function.
7. (a) Adjacent amino acids in a polypeptide chain. [1]
Answer:
- Peptide bond
7. (b) Complementary nitrogenous bases in DNA. [1]
Answer:
- Hydrogen bond(s)
8. State two functions of proteins in living organisms and give one named example for each function. [2]
Answer:
- Enzymatic/catalytic function — e.g., catalase (breaks down hydrogen peroxide).
- Structural function — e.g., collagen (provides structural support in connective tissue).
- Also accept: transport (haemoglobin), defence (antibodies/immunoglobulins), motor (myosin), signalling (insulin), storage (ferritin), receptor (membrane receptors).
Marking scheme:
- 1 mark per function + correct named example. Accept any valid function with a correct named example.
Section B: Structured Questions
9. (a) Identify the organelles labelled A to F in Figure 1. [3]
Answer: (Note: The specific identification depends on which organelles the labels A–F point to in the generated figure. Below is a typical allocation based on the image_placeholder description.)
- A: Nucleus
- B: Rough endoplasmic reticulum (RER)
- C: Mitochondrion
- D: Golgi apparatus
- E: Lysosome
- F: Ribosome (free)
Marking scheme:
- ½ mark per correct identification × 6 = 3 marks. Accept any reasonable allocation consistent with the diagram.
9. (b) Describe the role of the organelle labelled B (rough endoplasmic reticulum) in the secretion of proteins. [2]
Answer:
- The RER has ribosomes attached to its cytoplasmic surface, which are the site of protein synthesis (translation).
- Newly synthesised polypeptides are folded into their correct 3D shape within the lumen of the RER.
- The RER also performs quality control — misfolded proteins are identified and refolded or targeted for degradation.
- Proteins are transported from the RER to the Golgi apparatus via transport vesicles that bud off from the RER.
Marking scheme:
- 1 mark: protein synthesis/translation occurs on ribosomes of RER.
- 1 mark: proteins are folded/modified/transported in vesicles to Golgi.
9. (c) Explain why organelle C (mitochondrion) is found in large numbers in cells that are highly metabolically active, such as muscle cells. [2]
Answer:
- Mitochondria are the site of aerobic respiration (specifically the Krebs cycle in the matrix and oxidative phosphorylation/electron transport chain on the inner membrane/cristae), where ATP is produced.
- Highly metabolically active cells such as muscle cells require large amounts of ATP for contraction and other energy-requiring processes.
- Therefore, more mitochondria are needed to meet the high energy demand of these cells.
Marking scheme:
- 1 mark: mitochondria produce ATP via aerobic respiration.
- 1 mark: high metabolic activity requires large amounts of ATP, hence more mitochondria.
10. (a) Identify the components labelled W, X, Y, and Z in Figure 2. [2]
Answer: (Typical allocation based on the image_placeholder description:)
- W: Phospholipid (or phospholipid bilayer)
- X: Integral/transmembrane protein
- Y: Cholesterol
- Z: Glycoprotein
Marking scheme:
- ½ mark per correct identification × 4 = 2 marks.
10. (b) With reference to Figure 2, explain how the structure of the phospholipid bilayer provides a barrier to the movement of ions and polar molecules across the membrane. [3]
Answer:
- The interior of the phospholipid bilayer consists of hydrophobic fatty acid tails (nonpolar hydrocarbon chains).
- Ions and polar molecules are hydrophilic (charged or polar) and cannot easily dissolve in or pass through this hydrophobic core.
- The hydrophobic interior therefore acts as a barrier, preventing the free diffusion of ions and polar molecules across the membrane.
- These substances require channel proteins or carrier proteins (integral membrane proteins) to cross the membrane.
Marking scheme:
- 1 mark: hydrophobic/nonpolar interior of the bilayer (fatty acid tails).
- 1 mark: ions/polar molecules are hydrophilic and cannot pass through the hydrophobic core.
- 1 mark: reference to the need for transport proteins (channel/carrier proteins).
10. (c) Explain the role of cholesterol in the cell surface membrane. [2]
Answer:
- Cholesterol molecules are located between the phospholipid tails in the bilayer.
- At high temperatures, cholesterol restricts the movement of phospholipids, reducing membrane fluidity and making the membrane less permeable to small molecules.
- At low temperatures, cholesterol prevents the fatty acid tails from packing too closely together, maintaining membrane fluidity and preventing the membrane from becoming too rigid.
Marking scheme:
- 1 mark: cholesterol regulates membrane fluidity (restricts phospholipid movement at high temps / prevents tight packing at low temps).
- 1 mark: cholesterol reduces membrane permeability to small molecules / maintains membrane stability.
11. (a) Describe the relationship between enzyme concentration and rate of reaction as shown in Figure 3. [2]
Answer:
- As enzyme concentration increases from 0 to approximately 5 arbitrary units, the rate of reaction increases rapidly/steeply (from 0 to approximately 37 cm³/min).
- Above approximately 5–6 units of enzyme concentration, the rate of reaction begins to level off/plateau, reaching a maximum rate of approximately 45 cm³/min.
- The relationship is not directly proportional — it is a curve that plateaus.
Marking scheme:
- 1 mark: initial increase in rate with enzyme concentration.
- 1 mark: rate plateaus/levels off at higher enzyme concentrations.
11. (b) Explain why the rate of reaction plateaus at high enzyme concentrations. [2]
Answer:
- At high enzyme concentrations, the substrate concentration becomes the limiting factor.
- All substrate molecules are already bound to enzyme active sites (enzyme-substrate complexes are at maximum), so adding more enzyme does not increase the rate because there is no additional substrate available for the extra enzyme molecules to act on.
- The system has reached the maximum rate (Vmax) for the given substrate concentration.
Marking scheme:
- 1 mark: substrate concentration is the limiting factor.
- 1 mark: all substrate is bound / no free substrate available for additional enzyme / Vmax reached.
11. (c) Sketch curve X on the axes of Figure 3. [1]
Answer:
- Curve X should be drawn on the same axes, showing a similar shape (rising then plateauing) but with a lower plateau (lower maximum rate) than the original curve.
- The plateau should occur at approximately the same or slightly lower enzyme concentration, but the maximum rate should be lower (e.g., plateau at ~25–30 cm³/min instead of ~45 cm³/min).
Marking scheme:
- 1 mark: curve X shows the same general shape but with a lower maximum rate/plateau.
11. (d) Explain the shape of curve X that you have drawn. [2]
Answer:
- With a lower substrate concentration, there are fewer substrate molecules available to bind to enzyme active sites at any given enzyme concentration.
- Therefore, the maximum rate (Vmax) is lower because the enzyme molecules become saturated with substrate at a lower rate of product formation.
- The plateau occurs at a lower rate because the limited substrate is the constraining factor — even with excess enzyme, the reaction cannot proceed faster than the available substrate allows.
Marking scheme:
- 1 mark: fewer substrate molecules available, so maximum rate is lower.
- 1 mark: enzyme saturation occurs at a lower rate because substrate is limiting.
12. (a) Identify the regions labelled P, Q, and R in Figure 4. [2]
Answer: (Typical allocation based on the image_placeholder description:)
- P: Outer mitochondrial membrane
- Q: Intermembrane space
- R: Mitochondrial matrix
Marking scheme:
- Award marks based on the actual labels in the generated figure. 1 mark for each correct identification (up to 2 marks for 3 labels — best two awarded, or ⅔ mark each).
12. (b) Explain why the inner mitochondrial membrane is highly folded into cristae. [2]
Answer:
- The folds (cristae) increase the surface area of the inner mitochondrial membrane.
- This provides more space for the electron transport chain proteins (protein complexes I–IV) and ATP synthase enzymes that are embedded in the inner membrane.
- A greater surface area allows for more oxidative phosphorylation to occur simultaneously, producing more ATP per mitochondrion.
Marking scheme:
- 1 mark: increases surface area.
- 1 mark: more space for electron transport chain / ATP synthase / more ATP production.
12. (c) Name one stage of aerobic respiration that occurs in region R (matrix) and state what is produced during this stage. [2]
Answer:
- Krebs cycle (citric acid cycle) occurs in the mitochondrial matrix.
- Products per turn of the cycle: 2 CO₂ (waste), 3 NADH, 1 FADH₂, and 1 ATP (via substrate-level phosphorylation). (Also accept: reduced coenzymes / NADH and FADH₂.)
Marking scheme:
- 1 mark: correct stage name (Krebs cycle / citric acid cycle).
- 1 mark: correct product(s) stated.
Section C: Data-Based and Extended Response Questions
13. (a) With reference to the passage, describe the structural difference between PrP^C and PrP^Sc. [2]
Answer:
- PrP^C has a predominantly alpha-helical secondary structure.
- PrP^Sc has a high proportion of beta-sheet secondary structure.
- This is a conformational change — the same polypeptide chain folds differently.
Marking scheme:
- 1 mark: PrP^C has alpha-helical structure.
- 1 mark: PrP^Sc has beta-sheet structure.
13. (b) Explain why PrP^Sc is resistant to protease digestion. [2]
Answer:
- The change in secondary structure from alpha-helix to beta-sheet causes PrP^Sc to aggregate and form insoluble fibrils.
- The tightly packed beta-sheet aggregates hide or bury the peptide bonds that proteases would normally recognise and cleave.
- The insoluble, compact structure of the fibrils makes the protein inaccessible to protease enzymes.
Marking scheme:
- 1 mark: beta-sheet structure leads to aggregation/insoluble fibril formation.
- 1 mark: peptide bonds are inaccessible / proteases cannot access cleavage sites.
13. (c) Explain how prion diseases can spread within an individual even though prions do not contain nucleic acids. [3]
Answer:
- PrP^Sc acts as a template that induces the misfolding of normal PrP^C molecules upon direct contact.
- Each newly misfolded PrP^Sc molecule can then go on to convert more PrP^C molecules, creating a chain reaction / self-propagating cycle.
- This leads to an exponential increase in the amount of PrP^Sc, which accumulates as insoluble aggregates, causing neuronal damage and disease progression.
- Since the process is based on protein conformational change rather than nucleic acid replication, prions do not need genetic material to propagate.
Marking scheme:
- 1 mark: PrP^Sc acts as a template / induces misfolding of PrP^C.
- 1 mark: chain reaction / self-propagating / exponential increase.
- 1 mark: no nucleic acids needed because propagation is via protein conformational change.
13. (d) Suggest why a mutation in the gene encoding PrP^C could lead to an increased likelihood of the protein misfolding. [2]
Answer:
- A mutation in the gene changes the DNA base sequence, which changes the mRNA codon sequence, which changes the amino acid sequence (primary structure) of the PrP^C protein.
- The altered amino acid sequence may affect the hydrogen bonding pattern and other interactions that determine how the protein folds, making it more likely to adopt the beta-sheet conformation (PrP^Sc) rather than the normal alpha-helical conformation.
- Certain amino acid substitutions may destabilise the native fold or create new interactions that favour the misfolded form.
Marking scheme:
- 1 mark: mutation changes DNA/mRNA/amino acid sequence.
- 1 mark: altered amino acid sequence affects protein folding / destabilises native conformation / favours beta-sheet formation.
14. (a) Describe the relationship between sucrose concentration and the percentage change in mass of the plant cells. [2]
Answer:
- As sucrose concentration increases from 0.0 to 0.8 mol dm⁻³, the percentage change in mass decreases.
- At low sucrose concentrations (0.0–0.3 mol dm⁻³), the percentage change in mass is positive (cells gain mass).
- At high sucrose concentrations (0.4–0.8 mol dm⁻³), the percentage change in mass is negative (cells lose mass).
- The relationship shows a negative correlation (downward trend).
Marking scheme:
- 1 mark: percentage change in mass decreases as sucrose concentration increases (negative correlation).
- 1 mark: cells gain mass at low concentrations and lose mass at high concentrations (or identifies the transition point).
14. (b) Estimate the sucrose concentration at which there is no net movement of water into or out of the cells. Explain your reasoning. [2]
Answer:
- Approximately 0.35 mol dm⁻³.
- At this concentration, the percentage change in mass is 0% (the curve crosses the x-axis), meaning there is no net movement of water into or out of the cells.
- This indicates that the water potential of the sucrose solution is equal to the water potential of the cell contents (incipient plasmolysis / equilibrium).
Marking scheme:
- 1 mark: correct estimate (0.3–0.4 mol dm⁻³ accepted).
- 1 mark: explanation referencing 0% change / no net water movement / water potential equilibrium.
14. (c) Explain, in terms of water potential, why the plant cells placed in 0.6 mol dm⁻³ sucrose solution showed a decrease in mass. [3]
Answer:
- The 0.6 mol dm⁻³ sucrose solution has a lower (more negative) water potential than the water potential inside the plant cells.
- Water moves by osmosis from a region of higher water potential (inside the cell) to a region of lower water potential (the sucrose solution) across the partially permeable cell surface membrane.
- As water leaves the cell, the vacuole and cytoplasm shrink, the protoplast pulls away from the cell wall (plasmolysis), and the cell loses mass.
Marking scheme:
- 1 mark: sucrose solution has lower (more negative) water potential than the cell.
- 1 mark: water moves by osmosis from higher to lower water potential (into the solution).
- 1 mark: water loss causes decrease in mass / cell becomes plasmolysed.
14. (d) A student suggested that the cell wall prevents the plant cell from bursting in a hypotonic solution. Evaluate this statement with reference to the structure and properties of the cell wall. [3]
Answer:
- The statement is partially correct but requires qualification.
- In a hypotonic solution, water enters the cell by osmosis, causing the cell to swell. The cell wall is made of cellulose, which is strong and relatively inelastic/rigid.
- The cell wall exerts a pressure (wall pressure) that counteracts the inward osmotic pressure (turgor pressure), preventing the cell from bursting.
- However, the cell wall does not prevent the cell from swelling — it simply limits the extent of swelling. The cell becomes turgid (firm) when the wall pressure equals the osmotic pressure.
- The cell wall is fully permeable to water and solutes, so it does not act as a selectively permeable barrier — that role belongs to the cell surface membrane.
- Therefore, the cell wall prevents bursting but not swelling; the cell reaches a maximum turgid state.
Marking scheme:
- 1 mark: cell wall is made of cellulose and is strong/rigid/inelastic.
- 1 mark: cell wall exerts wall pressure that counteracts osmotic influx, preventing bursting.
- 1 mark: cell wall is fully permeable (not selectively permeable) — it limits swelling but does not prevent it; the cell becomes turgid.
Mark Summary
| Section | Marks |
|---|---|
| Section A (Q1–Q8) | 20 |
| Section B (Q9–Q12) | 25 |
| Section C (Q13–Q14) | 15 |
| Total | 60 |
End of Answer Key
Free quiz and exam paper access
Enter your details to view this paper
Your access is remembered on this device.