AI Generated Quiz
A Level H1 Biology Plant Biology Quiz
Free A Level H1 Biology Plant Biology quiz, LongCat AI version, with questions, answers, and A Level-style practice for Singapore students.
These static practice materials are generated from the site's syllabus and paper-generation workflow, with source and model context shown so students and parents can evaluate the material before use.
Questions
A-Level Biology H1 Quiz - Plant Biology
Name: ___________________________
Class: ___________________________
Date: ___________________________
Score: ________ / 50
Duration: 60 minutes
Total Marks: 50
Instructions:
- Answer ALL questions in the spaces provided.
- The number of marks for each question or part-question is shown in brackets [ ].
- You are advised to spend no more than 60 minutes on this quiz.
- Where diagrams are referenced, study the figure carefully before answering.
- Write your answers in the spaces provided. If you need extra space, use the blank pages at the end of this paper.
Section A: Multiple Choice (Questions 1–5) [10 marks]
Each question is worth 2 marks. Choose the one best answer.
1. Which of the following correctly describes the role of the Casparian strip in the endodermis of a plant root?
A. It facilitates the apoplastic movement of water into the xylem.
B. It blocks the apoplastic pathway, forcing water and solutes to pass through the selectively permeable cell membrane of endodermal cells.
C. It actively pumps mineral ions from the cortex into the phloem.
D. It increases the rate of transpiration by reducing resistance to water flow.
Answer: _______________ [2]
2. During the light-dependent reactions of photosynthesis, the electron transport chain in the thylakoid membrane directly results in:
A. the fixation of carbon dioxide into glycerate-3-phosphate.
B. the production of ATP and NADPH by photophosphorylation and the reduction of NADP⁺.
C. the synthesis of glucose from triose phosphate.
D. the release of carbon dioxide as a by-product of photorespiration.
Answer: _______________ [2]
3. A student investigates the effect of light intensity on the rate of photosynthesis in Elodea. The student counts the number of oxygen bubbles produced per minute at different distances from a lamp. Which of the following is the independent variable in this experiment?
A. The number of oxygen bubbles produced per minute.
B. The distance of the Elodea from the lamp.
C. The species of plant used (Elodea).
D. The temperature of the water.
Answer: _______________ [2]
4. Which of the following best explains why the rate of transpiration decreases when stomata close?
A. The water potential gradient between the leaf interior and the surrounding air increases.
B. The pathway for water vapour loss from the leaf to the atmosphere is restricted.
C. The cohesion between water molecules in the xylem is disrupted.
D. The rate of active transport of mineral ions into the root increases.
Answer: _______________ [2]
5. In the mass flow hypothesis for phloem transport, sucrose is moved from source to sink because:
A. water follows sucrose into the phloem at the sink by osmosis, creating a pressure gradient.
B. sucrose is actively loaded into the phloem at the source, lowering water potential and causing water to enter by osmosis, generating turgor pressure.
C. the xylem directly pumps sucrose through the phloem sieve tubes using ATP.
D. diffusion alone drives sucrose from source to sink along a concentration gradient.
Answer: _______________ [2]
Section B: Structured Questions (Questions 6–15) [25 marks]
6. (a) State two structural adaptations of xylem vessels that enable efficient transport of water in plants. [2]
(b) Explain how the cohesion-tension theory accounts for the upward movement of water from roots to leaves. [3]
7. Fig. 1 shows a transverse section of a dicotyledonous leaf as seen under a light microscope.
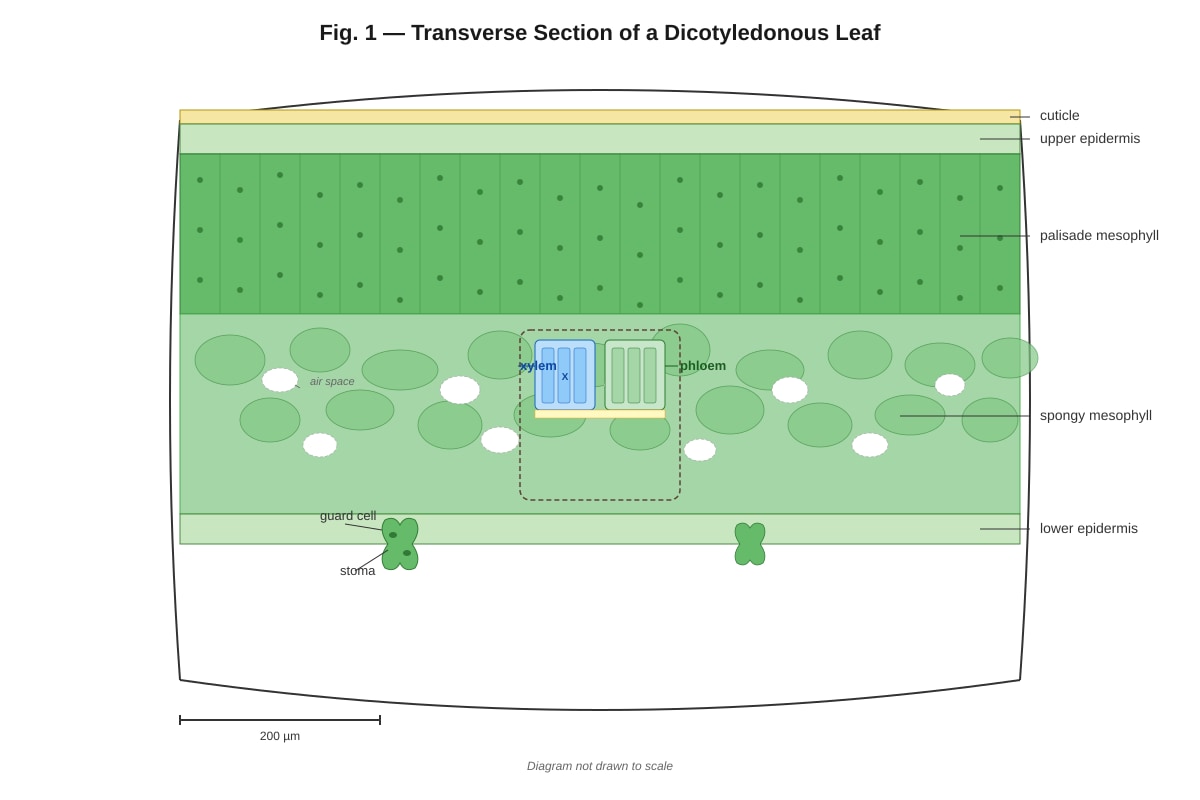
Generated diagram for Q7.
(a) With reference to Fig. 1, identify tissue X and state its function. [2]
(b) Explain how the structure of the palisade mesophyll tissue is adapted for its role in photosynthesis. [2]
8. A student carried out an experiment to investigate the effect of temperature on the permeability of beetroot cell membranes. Beetroot discs of equal size were placed in distilled water at different temperatures for 10 minutes. The colour intensity of the solution (due to leakage of betalain pigment) was measured using a colorimeter.
The results are shown in Table 1.
| Temperature / °C | Mean absorbance (arbitrary units) |
|---|---|
| 10 | 0.05 |
| 20 | 0.08 |
| 30 | 0.12 |
| 40 | 0.35 |
| 50 | 0.72 |
| 60 | 0.95 |
| 70 | 0.98 |
Table 1
(a) Describe the trend shown in Table 1. [2]
(b) Explain the results obtained at 60 °C and 70 °C with reference to membrane structure. [3]
9. (a) Define the term transpiration. [1]
(b) Explain how two environmental factors affect the rate of transpiration. [4]
10. Fig. 2 shows the absorption spectrum of chlorophyll a and the action spectrum of photosynthesis.
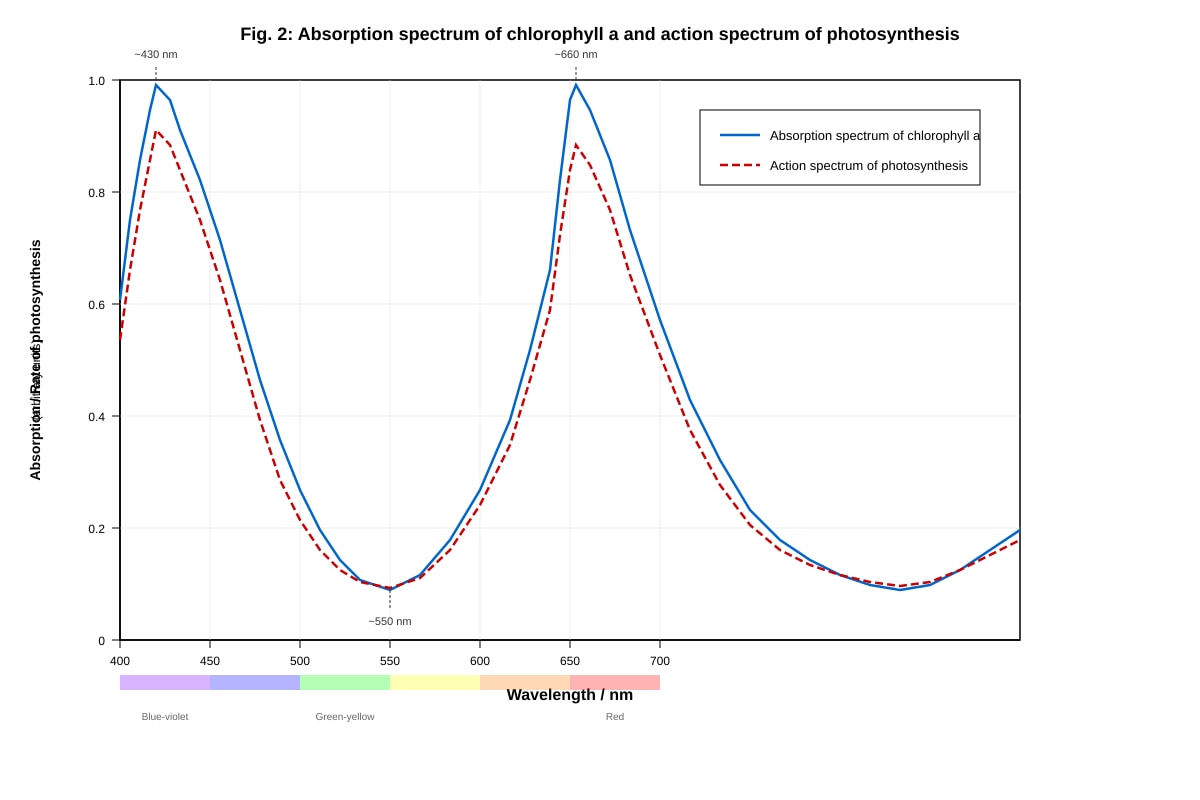
Generated graph for Q10.
(a) With reference to Fig. 2, state the wavelength at which the rate of photosynthesis is lowest. [1]
(b) Explain why the action spectrum and absorption spectrum are similar but not identical. [3]
11. Describe the role of ATP and NADPH in the light-independent reactions (Calvin cycle) of photosynthesis. [3]
12. (a) State one difference between the structure of a monocot stem and a dicot stem in terms of vascular bundle arrangement. [1]
(b) Explain why the arrangement of vascular bundles in a dicot stem is advantageous for secondary growth. [2]
13. A potometer is used to measure the rate of water uptake by a plant shoot. A student sets up a potometer and records the distance moved by an air bubble in the capillary tube over 5 minutes under normal laboratory conditions. The student then places a fan near the shoot and repeats the measurement.
(a) Predict the effect of the fan on the rate of water uptake. Explain your answer. [3]
(b) State one limitation of using a potometer to estimate the rate of transpiration. [1]
14. Explain how the opening and closing of stomata is controlled by guard cells during the day. [4]
15. (a) State the source and sink in phloem transport. [2]
(b) Describe how sucrose is loaded into the phloem sieve tubes at the source. [3]
Section C: Data-Based and Extended Response (Questions 16–20) [15 marks]
16. Fig. 3 shows the effect of light intensity on the rate of photosynthesis of a C₃ plant at two different carbon dioxide concentrations (0.04% and 0.08%) at 25 °C.
Generated graph for Q16.
(a) With reference to Fig. 3, state the light compensation point. [1]
(b) Explain why the rate of photosynthesis plateaus at high light intensity for the plant at 0.04% CO₂. [2]
(c) Using the data in Fig. 3, explain the effect of increasing carbon dioxide concentration on the rate of photosynthesis. [3]
17. An experiment was conducted to compare the distribution of stomata on the upper and lower epidermis of two plant species: Species X (a floating aquatic plant) and Species Y (a terrestrial dicot). The results are shown in Table 2.
| Plant Species | Mean number of stomata per mm² (upper epidermis) | Mean number of stomata per mm² (lower epidermis) |
|---|---|---|
| Species X (aquatic) | 250 | 0 |
| Species Y (terrestrial) | 30 | 420 |
Table 2
(a) Calculate the ratio of stomata on the upper epidermis to the lower epidermis for Species Y. [1]
(b) Explain the difference in stomatal distribution between Species X and Species Y. [4]
18. A student investigates the effect of different wavelengths of light on the rate of photosynthesis using a water plant. The student uses coloured filters (red, green, blue) and measures the volume of oxygen produced in 10 minutes. The results are shown in Table 3.
| Colour of filter | Wavelength range / nm | Mean volume of oxygen produced / cm³ |
|---|---|---|
| Red | 620–700 | 4.8 |
| Green | 500–560 | 0.6 |
| Blue | 440–490 | 3.9 |
Table 3
(a) Account for the difference in the volume of oxygen produced under red and green light. [3]
(b) State one variable that should be kept constant in this experiment to ensure validity. [1]
19. Describe the pathway of water movement from the soil through the root to the xylem, including the apoplastic and symplastic pathways. [5]
20. A farmer notices that his crop plants are wilting despite adequate soil moisture. A plant physiologist suggests that the problem may be related to damage to the root system, reducing water uptake.
(a) Explain how damage to root hairs would reduce the rate of water uptake. [2]
(b) The farmer also observes that the leaves appear yellow (chlorotic). Suggest an explanation for this observation with reference to mineral ion uptake. [2]
(c) Explain why the cohesion-tension mechanism would be insufficient to transport water to the leaves if the xylem vessels contained air bubbles (embolisms). [2]
END OF QUIZ
Answers
A-Level Biology H1 Quiz - Plant Biology
Answer Key and Marking Scheme
Section A: Multiple Choice [10 marks]
1. Answer: B [2]
The Casparian strip is a band of suberin (a waxy, hydrophobic substance) in the cell walls of endodermal cells in plant roots. It blocks the apoplastic pathway (movement through cell walls and intercellular spaces), forcing water and dissolved mineral ions to pass through the selectively permeable plasma membrane of endodermal cells. This allows the plant to control which ions enter the stele and xylem.
- Common mistake: Choosing A — the Casparian strip blocks, not facilitates, apoplastic movement.
- Teaching note: The Casparian strip acts as a selective checkpoint, ensuring that harmful substances or excess ions are filtered out before water enters the vascular tissue.
2. Answer: B [2]
In the light-dependent reactions, light energy excites electrons in photosystem II and photosystem I. These electrons pass through an electron transport chain embedded in the thylakoid membrane. The energy released is used to pump protons (H⁺) into the thylakoid lumen, creating a proton gradient. ATP synthase uses this gradient to produce ATP (photophosphorylation). At the end of the chain, NADP⁺ is reduced to NADPH.
- Common mistake: Choosing A — carbon fixation occurs in the Calvin cycle (light-independent reactions), not the electron transport chain.
- Teaching note: ATP and NADPH are the two key products of the light-dependent reactions that power the Calvin cycle.
3. Answer: B [2]
The independent variable is the one that the experimenter deliberately changes. In this experiment, the student changes the distance of the Elodea from the lamp, which alters the light intensity reaching the plant. The number of oxygen bubbles is the dependent variable (what is measured). The species of plant and temperature are controlled variables.
- Common mistake: Choosing A — the number of bubbles is the dependent variable (outcome being measured).
- Teaching note: A useful way to identify the independent variable is to ask: "What did the experimenter deliberately change?"
4. Answer: B [2]
Stomata are small pores (mainly on the lower epidermis of leaves) through which water vapour exits the leaf during transpiration. When stomata close, the main pathway for water vapour loss is restricted, so the rate of transpiration decreases.
- Common mistake: Choosing A — closing stomata decreases the water potential gradient because less water vapour is lost, reducing the gradient between the moist leaf interior and the drier atmosphere.
- Teaching note: Stomatal closure is the plant's primary mechanism for reducing water loss during drought or high temperatures.
5. Answer: B [2]
In the mass flow hypothesis, sucrose is actively loaded into sieve tube elements at the source (e.g., photosynthesising leaves). This lowers the water potential inside the phloem. Water enters the phloem from the adjacent xylem by osmosis, increasing turgor pressure. At the sink (e.g., roots, fruits), sucrose is removed, raising water potential and causing water to leave by osmosis. The difference in turgor pressure between source and sink drives mass flow of sucrose solution through the phloem.
- Common mistake: Choosing A — water enters at the source, not the sink.
- Teaching note: The pressure-flow mechanism is driven by an osmotic gradient created by active loading and unloading of sucrose.
Section B: Structured Questions [25 marks]
6. (a) [2]
Any two of the following (1 mark each):
- Xylem vessels are hollow and open-ended, forming continuous columns with no cell contents, reducing resistance to water flow.
- Xylem vessel walls are lignified, providing structural support and preventing collapse under tension.
- Xylem vessels have small diameter, which aids capillary action.
- Pits in the walls allow lateral movement of water between vessels.
(b) [3]
- Cohesion: Water molecules are attracted to each other by hydrogen bonds, forming a continuous column of water in the xylem. [1]
- Tension: Transpiration from leaves creates a negative pressure (tension) that pulls the water column upwards. [1]
- Adhesion: Water molecules are attracted to the hydrophilic walls of xylem vessels, helping to prevent the water column from breaking. [1]
- Overall: The combination of cohesion, tension (from transpiration pull), and adhesion allows water to be pulled up from roots to leaves as a continuous column.
7. (a) [2]
- Tissue X: Palisade mesophyll. [1]
- Function: Contains many chloroplasts and is the main site of photosynthesis in the leaf. [1]
- Note: If the student labels a different tissue (e.g., spongy mesophyll), award marks accordingly if the identification and function are correct.
(b) [2]
- Palisade mesophyll cells are elongated and tightly packed, maximising the number of cells (and chloroplasts) per unit area exposed to light. [1]
- They are located near the upper surface of the leaf, where light intensity is highest, and contain a high density of chloroplasts to capture light energy efficiently. [1]
- Marking note: Award 1 mark for each valid adaptation linked to photosynthesis.
8. (a) [2]
- As temperature increases from 10 °C to 70 °C, the mean absorbance increases. [1]
- The increase is gradual between 10 °C and 30 °C, but becomes much more rapid above 40 °C, with the highest absorbance values at 60 °C and 70 °C. [1]
- Marking note: Award 1 mark for describing the general trend and 1 mark for noting the sharp increase above 40 °C.
(b) [3]
- At 60–70 °C, the high temperature denatures the proteins in the cell membrane (carrier proteins and channel proteins), disrupting the membrane structure. [1]
- The phospholipid bilayer becomes more fluid as the increased kinetic energy of phospholipids disrupts the orderly arrangement, creating gaps in the membrane. [1]
- The tonoplast (vacuole membrane) is also disrupted, allowing the betalain pigment stored in the vacuole to leak out into the surrounding water, causing high absorbance readings. [1]
- Teaching note: Membrane permeability increases at high temperatures because both the phospholipid bilayer and embedded proteins are damaged.
9. (a) [1]
- Transpiration is the loss of water vapour from the aerial parts of a plant (mainly through stomata in the leaves). [1]
- Accept: Evaporation of water from plant surfaces, especially through stomata.
(b) [4]
Any two environmental factors, 2 marks each:
Light intensity (2 marks):
- As light intensity increases, stomata open wider to allow CO₂ to enter for photosynthesis. [1]
- This increases the surface area for water vapour loss, increasing the rate of transpiration. [1]
Humidity (2 marks):
- As humidity decreases, the water potential gradient between the moist interior of the leaf and the surrounding air increases. [1]
- This increases the rate of diffusion of water vapour out of the leaf, increasing transpiration. [1]
Temperature (2 marks):
- As temperature increases, water molecules gain kinetic energy and evaporate more quickly from the mesophyll cell surfaces. [1]
- The water potential gradient steepens because warm air can hold more water vapour, increasing transpiration. [1]
Wind speed (2 marks):
- Moving air removes the boundary layer of humid air around the leaf surface. [1]
- This maintains a steep water potential gradient, increasing the rate of transpiration. [1]
10. (a) [1]
- The rate of photosynthesis is lowest at approximately 550 nm (green light). [1]
(b) [3]
- The absorption spectrum shows which wavelengths are absorbed by chlorophyll a, while the action spectrum shows the overall rate of photosynthesis at each wavelength. [1]
- The spectra are similar because chlorophyll a is a primary photosynthetic pigment and absorbs mainly blue-violet and red light, which are the wavelengths most effective for driving photosynthesis. [1]
- They are not identical because accessory pigments (e.g., chlorophyll b, carotenoids) absorb light at other wavelengths and transfer the energy to chlorophyll a, so photosynthesis can occur at wavelengths not directly absorbed by chlorophyll a. [1]
- Teaching note: The action spectrum reflects the combined contribution of all photosynthetic pigments, not just chlorophyll a.
11. [3]
- In the Calvin cycle, CO₂ is fixed to ribulose bisphosphate (RuBP, a 5C compound) by the enzyme RuBisCO, producing two molecules of glycerate-3-phosphate (GP, a 3C compound). [1]
- ATP provides the energy, and NADPH provides the reducing power (electrons and hydrogen ions) to convert GP into triose phosphate (TP, also a 3C). [1]
- Some TP is used to synthesise glucose and other organic molecules; the rest is used to regenerate RuBP, a process that also requires ATP. [1]
- Marking note: Award 1 mark for the role of ATP, 1 mark for the role of NADPH, and 1 mark for linking these to specific steps in the Calvin cycle.
12. (a) [1]
- In a monocot stem, vascular bundles are scattered throughout the ground tissue. [1]
- In a dicot stem, vascular bundles are arranged in a ring around the pith. [1]
- Accept: Any one correct difference.
(b) [2]
- In a dicot stem, the vascular bundles are arranged in a ring with fascicular cambium (a layer of meristematic cells) between the xylem and phloem in each bundle. [1]
- The fascicular cambium can divide to produce secondary xylem (towards the inside) and secondary phloem (towards the outside), enabling the stem to increase in girth (secondary growth). [1]
- Teaching note: Monocots generally lack cambium in their vascular bundles and therefore do not undergo significant secondary growth.
13. (a) [3]
- Prediction: The rate of water uptake will increase when the fan is used. [1]
- The fan removes the boundary layer of still, humid air surrounding the leaf surface. [1]
- This maintains a steeper water potential gradient between the leaf interior and the surrounding air, increasing the rate of transpiration, which in turn increases the rate of water uptake. [1]
(b) [1]
Any one of the following:
- The potometer measures water uptake, not water loss — not all water taken up is lost by transpiration (some is used in photosynthesis and for turgor maintenance). [1]
- Cutting the shoot may damage the xylem, affecting the rate of water uptake. [1]
- The air bubble may not move uniformly, introducing measurement error. [1]
14. [4]
- During the day, light triggers photosynthesis in guard cell chloroplasts, producing ATP. [1]
- ATP powers proton pumps (H⁺-ATPases) in the guard cell membrane, which pump H⁺ out of the cell. [1]
- This creates an electrochemical gradient that drives the uptake of K⁺ ions (and Cl⁻ ions) into the guard cells through ion channels. [1]
- The accumulation of K⁺ and other solutes lowers the water potential inside the guard cells. Water enters by osmosis, increasing turgor pressure. The guard cells swell and, because their inner walls are thicker than their outer walls, they curve apart, opening the stoma. [1]
- Marking note: Award 1 mark for each of the four key steps: light/ATP → proton pumping → K⁺ uptake → osmotic water entry → turgor-driven opening.
15. (a) [2]
- Source: A part of the plant where sucrose is produced or stored (e.g., photosynthesising leaves, storage organs mobilising starch). [1]
- Sink: A part of the plant where sucrose is used or stored (e.g., roots, growing tips, fruits, seeds). [1]
(b) [3]
- Sucrose is actively transported into the companion cells and then into the sieve tube elements at the source. [1]
- H⁺ ions are pumped out of the companion cell into the cell wall space by proton pumps (using ATP), creating a proton gradient. [1]
- Sucrose is co-transported into the companion cell via sucrose-H⁺ symporters (co-transport proteins), driven by the proton gradient. Sucrose then moves into the sieve tube through plasmodesmata. [1]
- Teaching note: This is an example of active loading — it requires energy (ATP) and cannot occur by diffusion alone.
Section C: Data-Based and Extended Response [15 marks]
16. (a) [1]
- The light compensation point is the light intensity at which the rate of photosynthesis equals the rate of respiration (net rate = 0). From Fig. 3, this occurs at approximately 5% light intensity. [1]
(b) [2]
- At high light intensity, light is no longer the limiting factor. [1]
- The rate plateaus because CO₂ concentration (0.04%) becomes the limiting factor — there is insufficient CO₂ to sustain a higher rate of carbon fixation in the Calvin cycle. [1]
- Accept: Enzyme concentration or RuBisCO activity becomes limiting.
(c) [3]
- At 0.08% CO₂, the rate of photosynthesis is higher at all light intensities compared to 0.04% CO₂. [1]
- This is because a higher CO₂ concentration provides more substrate for RuBisCO in the Calvin cycle, increasing the rate of carbon fixation. [1]
- The plateau occurs at a higher rate because the increased CO₂ concentration allows the Calvin cycle to operate at a faster rate before another factor (e.g., RuBisCO concentration, light intensity) becomes limiting. [1]
- Marking note: Award 1 mark for describing the difference, 1 mark for explaining the role of CO₂ as a substrate, and 1 mark for linking to the higher plateau.
17. (a) [1]
- Ratio = 30 : 420 = 1 : 14 (or 1/14). [1]
- Accept: 0.071 or any correct simplification.
(b) [4]
- Species X (aquatic, floating): The upper epidermis is exposed to air, so stomata are located here to allow gas exchange (CO₂ uptake and O₂ release). The lower epidermis is in contact with water, where stomata would be ineffective for gas exchange, so there are no stomata on the lower surface. [2]
- Species Y (terrestrial dicot): Stomata are predominantly on the lower epidermis, which reduces direct exposure to sunlight and wind, minimising excessive water loss by transpiration. The small number on the upper epidermis allows some gas exchange while limiting water loss. [2]
- Marking note: Award 2 marks for each species — 1 mark for describing the distribution and 1 mark for explaining the adaptive significance.
18. (a) [3]
- Red light (620–700 nm) is strongly absorbed by chlorophyll a and chlorophyll b, which have absorption peaks in the red region of the spectrum. [1]
- Green light (500–560 nm) is poorly absorbed by chlorophyll — it is mostly reflected (which is why leaves appear green). [1]
- Because red light is absorbed more efficiently, more light energy is available to drive the light-dependent reactions, producing more ATP and NADPH, which power the Calvin cycle, resulting in a higher rate of photosynthesis and more oxygen produced. [1]
(b) [1]
Any one of the following:
- Light intensity (must be the same for all filters). [1]
- Temperature. [1]
- CO₂ concentration. [1]
- Volume/mass of plant material. [1]
- Duration of the experiment. [1]
19. [5]
- Water moves from the soil into the root hair cells by osmosis, because the water potential inside the root hair cell is lower than in the soil solution (due to dissolved solutes). [1]
- Apoplastic pathway: Water moves through the cell walls and intercellular spaces of the cortex without crossing any cell membranes. This is a passive pathway driven by the water potential gradient. [1]
- Symplastic pathway: Water moves from cell to cell through the cytoplasm, passing between cells via plasmodesmata. This also follows the water potential gradient. [1]
- At the endodermis, the Casparian strip blocks the apoplastic pathway, forcing water (and dissolved ions) to pass through the selectively permeable membrane of endodermal cells. This allows the plant to control which ions enter the stele. [1]
- Water then enters the xylem vessels in the stele and is transported upwards through the stem to the leaves, driven by transpiration pull (cohesion-tension mechanism). [1]
- Marking note: Award 1 mark for each of the five key points: osmosis into root hair, apoplastic pathway, symplastic pathway, Casparian strip, and entry into xylem.
20. (a) [2]
- Root hairs are extensions of root epidermal cells that greatly increase the surface area of the root in contact with soil water. [1]
- Damage to root hairs reduces the surface area available for water uptake by osmosis, decreasing the rate of water absorption. [1]
(b) [2]
- Yellowing (chlorosis) indicates a deficiency in chlorophyll. [1]
- Chlorophyll synthesis requires mineral ions such as magnesium (Mg²⁺) and nitrogen (in the form of nitrate or ammonium ions). Damage to the root system reduces the uptake of these essential mineral ions, leading to chlorosis. [1]
- Accept: Iron (Fe²⁺) deficiency also causes chlorosis.
(c) [2]
- The cohesion-tension mechanism relies on a continuous column of water in the xylem, held together by hydrogen bonds (cohesion). [1]
- Air bubbles (embolisms) break the continuity of the water column, disrupting cohesion. The tension created by transpiration pull cannot be transmitted through the air bubble, so water transport to the leaves is impaired. [1]
- Teaching note: This is analogous to a "cavitation" event — once the water column breaks, the xylem vessel can no longer function in water transport.
Mark Summary
| Section | Marks |
|---|---|
| A: Questions 1–5 (MCQ) | 10 |
| B: Questions 6–15 (Structured) | 25 |
| C: Questions 16–20 (Data/Extended) | 15 |
| Total | 50 |
End of Answer Key
Free quiz and exam paper access
Enter your details to view this paper
Your access is remembered on this device.