AI Generated Quiz
A Level H1 Biology Evolution Diversity Quiz
Free A Level H1 Biology Evolution Diversity quiz, LongCat AI version, with questions, answers, and A Level-style practice for Singapore students.
These static practice materials are generated from the site's syllabus and paper-generation workflow, with source and model context shown so students and parents can evaluate the material before use.
Questions
A-Level Biology H1 Quiz - Evolution Diversity
Name: ___________________________
Class: ___________________________
Date: ___________________________
Score: ________ / 50
Duration: 60 minutes
Total Marks: 50
Instructions:
- Answer ALL questions in the spaces provided.
- Write your answers clearly and in complete sentences where required.
- The number of marks for each question is shown in brackets [ ].
- Where diagrams or data are referenced, use the information provided to support your answers.
- You may use a calculator where necessary.
Section A: Multiple Choice (Questions 1–5) [10 marks]
Each question is worth 2 marks. Choose the one best answer.
1. Which of the following best describes the process of natural selection?
A. Organisms choose traits that help them survive.
B. Individuals with advantageous traits are more likely to survive and reproduce.
C. All members of a population evolve simultaneously.
D. Mutations occur in response to environmental pressures.
2. The pentadactyl limb in vertebrates (e.g., human arm, whale flipper, bat wing) is an example of:
A. Analogous structures arising from convergent evolution.
B. Homologous structures arising from a common ancestor.
C. Vestigial structures that no longer serve a function.
D. Artificial selection by humans.
3. Which of the following provides the strongest molecular evidence for evolution?
A. Similarities in bone structure among mammals.
B. Shared embryonic development patterns.
C. High degree of DNA sequence similarity between humans and chimpanzees.
D. Fossil records showing transitional forms.
4. A population of beetles lives in a forest. Birds prey on the beetles, preferentially eating the green beetles over the brown ones because green beetles are more visible against the dark bark. Over time, the frequency of the brown allele increases. This is an example of:
A. Genetic drift.
B. Directional selection.
C. Stabilising selection.
D. Artificial selection.
5. Which of the following is a requirement for speciation to occur?
A. A single mutation in one individual.
B. Reproductive isolation between populations.
C. A change in the environment affecting all individuals equally.
D. The extinction of the ancestral species.
Section B: Structured Response (Questions 6–15) [25 marks]
6. State two conditions that must be met for a population to be in Hardy-Weinberg equilibrium. [2]
7. Explain what is meant by the term gene pool. [2]
8. Table 1 shows the number of individuals with different genotypes in a population of flowers.
| Genotype | Phenotype | Number of individuals |
|---|---|---|
| RR | Red | 490 |
| Rr | Pink | 420 |
| rr | White | 90 |
| Total | 1000 |
Table 1
(a) Calculate the frequency of the recessive allele (r) in this population. Show your working. [2]
(b) State whether this population is in Hardy-Weinberg equilibrium. Justify your answer with reference to your calculation. [2]
9. Describe two pieces of evidence that support the theory of evolution by natural selection. [4]
Evidence 1: _________________________________________________________________
Evidence 2: _________________________________________________________________
10. Explain how the fossil record provides evidence for evolution. Include in your answer what is meant by a transitional fossil. [3]
11. Distinguish between allopatric and sympatric speciation. [3]
Allopatric speciation: ________________________________________________________
Sympatric speciation: ________________________________________________________
12.
Generated graph for Q12.
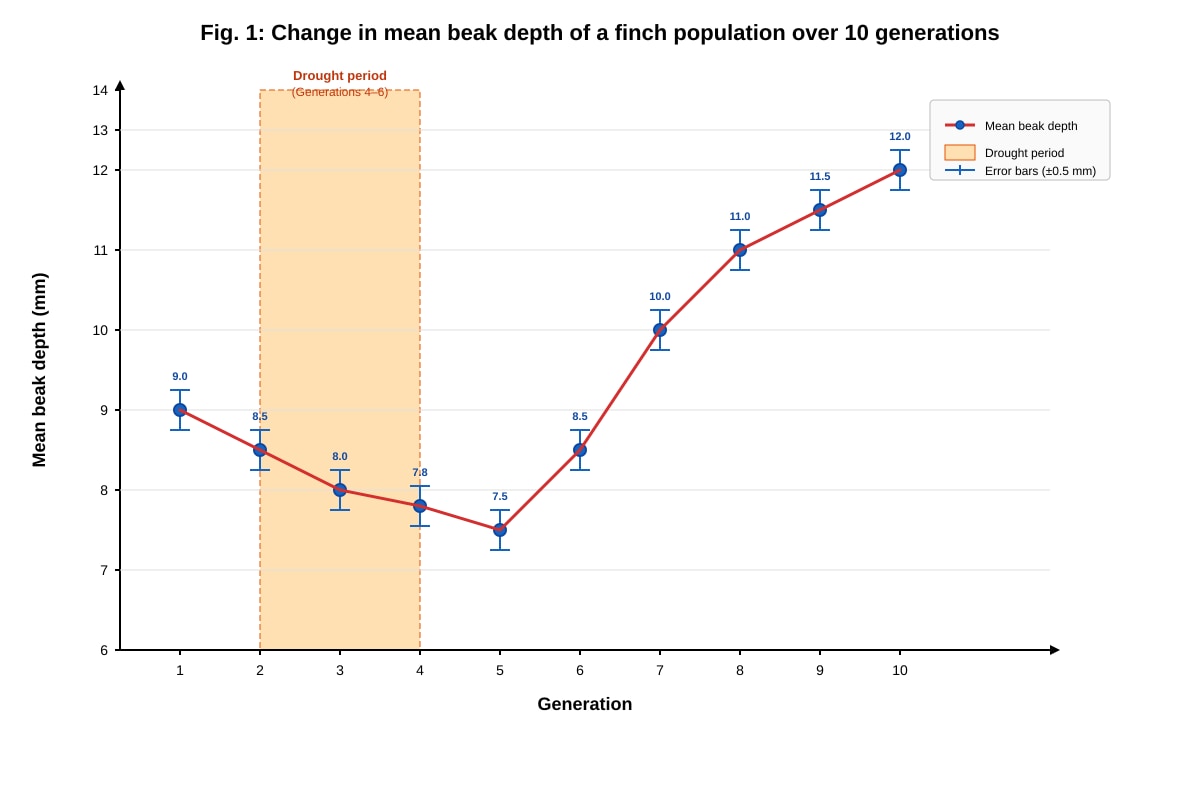
Fig. 1 shows the change in mean beak depth of a finch population over 10 generations.
(a) Describe the trend in mean beak depth shown in Fig. 1. [2]
(b) Suggest how the drought between generations 4 and 6 may have influenced the change in beak depth observed after generation 5. [2]
13. Explain how geographic isolation can lead to the formation of new species. [4]
14.
Generated diagram for Q14.
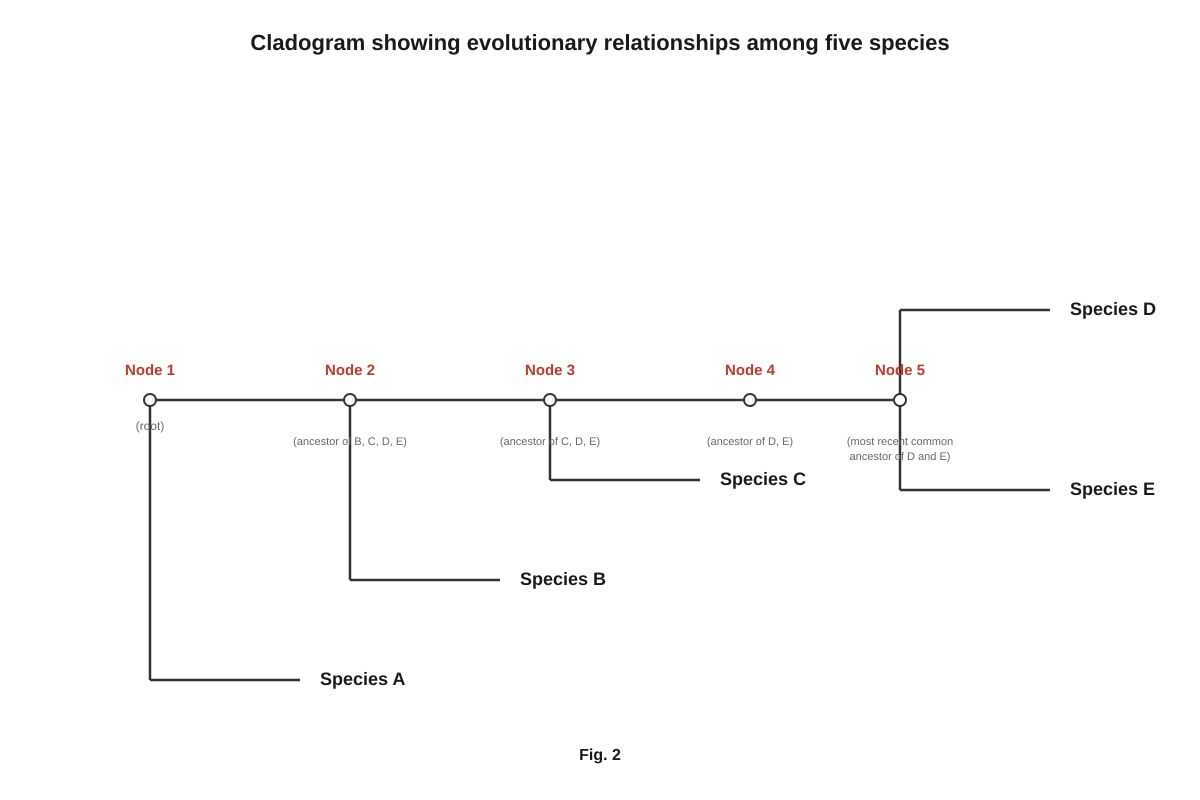
Fig. 2 is a cladogram showing the evolutionary relationships among five species.
(a) Which two species are most closely related? Explain your reasoning. [2]
(b) Identify the species that is the outgroup. Explain how you determined this. [2]
15. Describe the role of mutations in the process of evolution. [3]
Section C: Data-Based and Extended Response (Questions 16–20) [15 marks]
16.
Generated table for Q16.
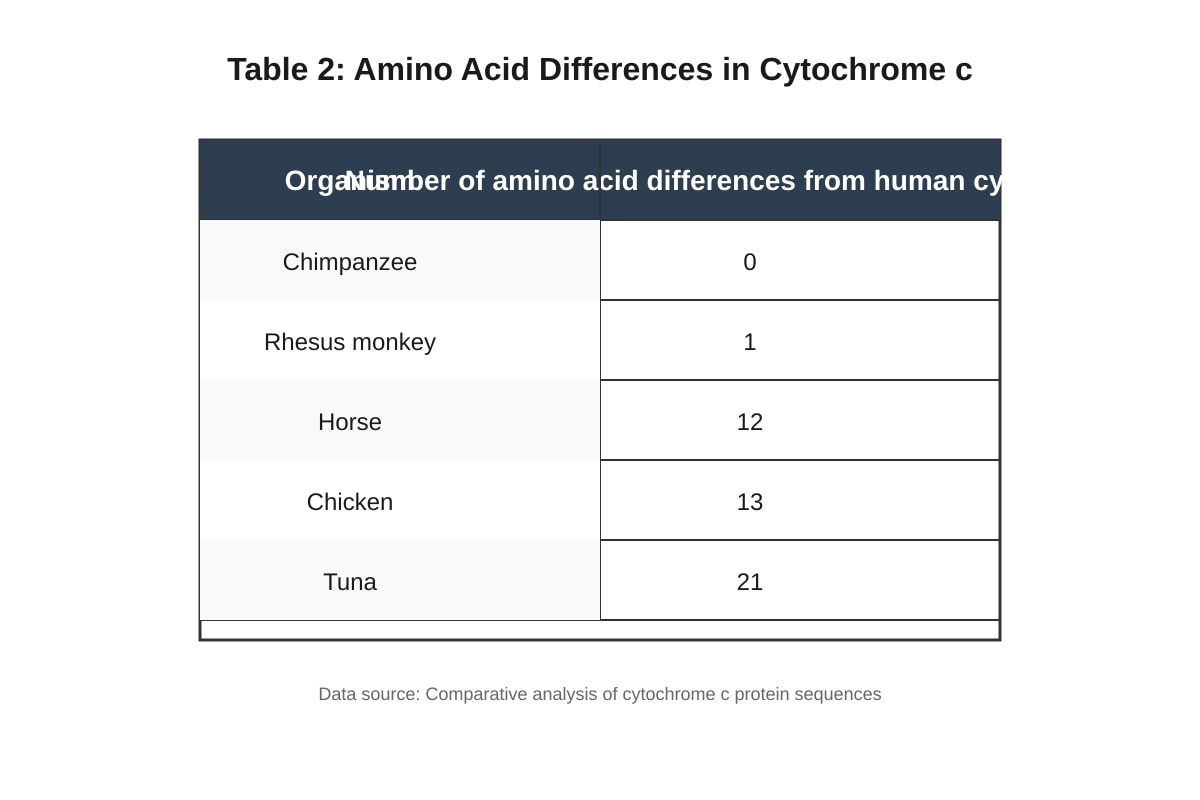
Table 2 shows the number of amino acid differences in the protein cytochrome c between humans and four other organisms.
(a) Explain what the data in Table 2 suggest about the evolutionary relationship between humans and the other organisms. [2]
(b) State one limitation of using molecular evidence alone to determine evolutionary relationships. [1]
17. A scientist studied two populations of a species of snail living on opposite sides of a mountain range. The snails on the east side have shells with a smooth surface, while those on the west side have shells with ridges. When individuals from the two populations were brought together in the laboratory, they were able to mate but produced offspring with low survival rates.
(a) Explain whether the two populations are the same species according to the biological species concept. [2]
(b) Suggest how the mountain range may have contributed to the divergence of the two populations. [2]
18. Explain how antibiotic resistance in bacteria is an example of evolution by natural selection. Your answer should include reference to variation, selection pressure, and reproduction. [4]
19.
Image pending generation: diagram for Q19.
Fig. 3 shows the divergence of a fish population after a lake splits into two ponds.
(a) Identify the type of natural selection that could have led to the divergence in body size and jaw structure between the two populations. [1]
(b) Explain how the scenario in Fig. 3 could eventually lead to speciation. [3]
20. Discuss the relative importance of natural selection and genetic drift in shaping the evolution of populations. In your answer, refer to population size and provide examples. [4]
End of Quiz
Answers
A-Level Biology H1 Quiz - Evolution Diversity
Answer Key and Marking Scheme
Section A: Multiple Choice [10 marks]
1. B [2]
Natural selection is the process by which individuals with traits that confer a survival or reproductive advantage in a given environment are more likely to survive and pass on their alleles to the next generation. Over time, this increases the frequency of advantageous alleles in the population.
- Why not A? Organisms do not "choose" traits; selection acts on existing variation.
- Why not C? Evolution occurs across populations over generations, not simultaneously in all individuals.
- Why not D? Mutations are random and not directed by environmental pressures.
2. B [2]
The pentadactyl limb is a classic example of a homologous structure — structures that share a common evolutionary origin (derived from a common ancestor) but may serve different functions in different species. The human arm is used for manipulation, the whale flipper for swimming, and the bat wing for flight, yet all share the same underlying bone arrangement (humerus, radius, ulna, carpals, metacarpals, phalanges).
- Why not A? Analogous structures (e.g., insect wing vs. bird wing) have similar functions but different evolutionary origins.
- Why not C? The pentadactyl limb is functional in all these species.
3. C [2]
DNA sequence similarity provides direct molecular evidence for common ancestry. Humans and chimpanzees share approximately 98.7% of their DNA sequence, indicating a very recent common ancestor. This is stronger evidence than anatomical or embryological similarities because it reflects the actual genetic code.
- Why not A, B, or D? While bone structure, embryology, and fossils all support evolution, molecular evidence (DNA/protein sequences) provides the most precise and quantifiable measure of relatedness.
4. B [2]
This is an example of directional selection, where one extreme of a trait distribution (brown coloration) is favoured over the other (green). The selection pressure (bird predation) consistently favours brown beetles, causing the allele frequency to shift in one direction over time.
- Why not A? Genetic drift involves random changes in allele frequency, not a consistent selective pressure.
- Why not C? Stabilising selection favours intermediate phenotypes, not extremes.
- Why not D? Artificial selection involves human intervention.
5. B [2]
Speciation requires reproductive isolation — a mechanism that prevents gene flow between populations. Without reproductive isolation, populations continue to interbreed and remain a single species. Reproductive isolation can be pre-zygotic (e.g., behavioural, temporal, mechanical) or post-zygotic (e.g., hybrid inviability, hybrid sterility).
- Why not A? A single mutation in one individual is insufficient; changes must spread through a population.
- Why not C? Environmental change alone does not cause speciation without isolation.
- Why not D? The ancestral species need not go extinct for new species to form.
Section B: Structured Response [25 marks]
6. Any two of the following conditions for Hardy-Weinberg equilibrium [1 mark each, total 2]:
- No mutations
- No natural selection (all genotypes have equal fitness)
- Random mating (no sexual selection)
- No gene flow (no migration into or out of the population)
- Very large population size (no genetic drift)
Teaching note: The Hardy-Weinberg principle describes a theoretical population in which allele frequencies remain constant from generation to generation. In reality, these conditions are rarely all met simultaneously, which is why evolution occurs in natural populations.
7. A gene pool is the total collection of all the alleles (genes) present in a population at a given time. [1] It includes all the genetic variation available in that population. [1]
Teaching note: The gene pool concept is important because evolution is defined as a change in allele frequencies within a gene pool over time. The larger and more diverse the gene pool, the greater the potential for a population to adapt to changing environments.
8. (a) To calculate the frequency of the recessive allele (r):
- Number of rr individuals = 90 out of 1000
- Frequency of rr genotype (q²) = 90/1000 = 0.09
- Frequency of r allele (q) = √0.09 = 0.30 [1 mark for correct working, 1 mark for correct answer]
(b) To check Hardy-Weinberg equilibrium:
- p + q = 1, so p = 1 − 0.30 = 0.70
- Expected RR = p² × 1000 = (0.70)² × 1000 = 0.49 × 1000 = 490 ✓
- Expected Rr = 2pq × 1000 = 2(0.70)(0.30) × 1000 = 0.42 × 1000 = 420 ✓
- Expected rr = q² × 1000 = (0.30)² × 1000 = 0.09 × 1000 = 90 ✓
- The observed values match the expected values exactly, so the population is in Hardy-Weinberg equilibrium. [1 mark for stating yes/no with justification]
Teaching note: This question tests understanding of the Hardy-Weinberg equation: p² + 2pq + q² = 1, where p is the frequency of the dominant allele and q is the frequency of the recessive allele.
9. Any two of the following pieces of evidence, each explained [2 marks each, total 4]:
Fossil record: Fossils show a progression of life forms from simple to complex over geological time. Transitional fossils (e.g., Archaeopteryx showing features of both reptiles and birds) demonstrate intermediate forms between major groups, supporting the idea of gradual change. [2]
Homologous structures: Similar anatomical structures in different species (e.g., pentadactyl limb in vertebrates) suggest descent from a common ancestor. These structures may serve different functions but share the same underlying bone arrangement. [2]
Molecular evidence (DNA/protein sequences): Species that are more closely related share a higher percentage of DNA and protein sequences. For example, humans and chimpanzees share ~98.7% DNA similarity, indicating a recent common ancestor. [2]
Embryonic development: Closely related organisms often show similar patterns of embryonic development (e.g., presence of gill slits and tails in vertebrate embryos), suggesting shared ancestry. [2]
Biogeography: The geographic distribution of species matches patterns predicted by evolution. For example, island species are most closely related to species on the nearest mainland, suggesting colonisation and subsequent divergence. [2]
10. The fossil record provides evidence for evolution by showing how organisms have changed over geological time. [1] Fossils are found in sedimentary rock layers, with simpler organisms in older (deeper) layers and more complex organisms in younger (shallower) layers, indicating a progression of life forms. [1] A transitional fossil is a fossil that shows intermediate characteristics between an ancestral species and its descendants, providing direct evidence of evolutionary change. For example, Tiktaalik shows features of both fish (fins, scales) and tetrapods (a neck, flat head, and limb-like fins), representing the transition from aquatic to terrestrial vertebrates. [1]
Teaching note: The fossil record is incomplete because fossilisation is a rare event requiring specific conditions. However, the fossils that have been discovered consistently support evolutionary theory.
11. Allopatric speciation occurs when a population is divided by a geographic barrier (e.g., mountain range, river, ocean), preventing gene flow between the separated groups. Over time, genetic differences accumulate due to mutation, natural selection, and genetic drift in different environments, eventually leading to reproductive isolation and the formation of new species. [1.5]
Sympatric speciation occurs within a single, geographically continuous population without physical separation. It can arise through mechanisms such as polyploidy (especially in plants), habitat differentiation, or sexual selection, where subpopulations become reproductively isolated despite living in the same area. [1.5]
Teaching note: Allopatric speciation is generally considered more common than sympatric speciation, particularly in animals.
12. (a) The mean beak depth decreases from approximately 9.0 mm in generation 1 to approximately 7.5 mm by generation 5. [1] After generation 5, the mean beak depth increases sharply, reaching approximately 12.0 mm by generation 10. [1]
(b) During the drought (generations 4–6), the availability of small, soft seeds may have decreased, favouring finches with smaller beaks that could exploit remaining small seeds more efficiently. [1] After the drought ended, larger, harder seeds may have become more abundant, favouring finches with larger, more robust beaks capable of cracking them. This would explain the shift toward increased mean beak depth after generation 5. [1]
Expected visual features for Fig. 1: The graph should show a clear downward trend from generation 1 to 5, followed by a steep upward trend from generation 5 to 10. The shaded drought bar between generations 4 and 6 should be clearly visible. Error bars should be present on each data point. Axes must be clearly labelled with appropriate scales.
13. Geographic isolation occurs when a physical barrier (e.g., mountain range, river, ocean) divides a population into two or more separate groups, preventing gene flow between them. [1] Once isolated, the separated populations experience different environmental conditions and selection pressures. [1] Mutations arise independently in each population, and natural selection favours different alleles in each environment. [1] Over many generations, genetic differences accumulate to the point where, even if the populations come back into contact, they can no longer interbreed successfully (reproductive isolation), and they are considered separate species. [1]
Teaching note: This describes allopatric speciation, the most common mode of speciation. The key requirement is the cessation of gene flow, which allows populations to diverge independently.
14. (a) Species D and Species E are most closely related. [1] This is because they share the most recent common ancestor (Node 5), which is the most terminal (furthest from the root) internal node on the cladogram. [1]
(b) Species A is the outgroup. [1] Species A branches off first from the root (Node 1), meaning it diverged earliest from the common ancestor of all five species and is therefore the most distantly related to the others. [1]
Expected visual features for Fig. 2: The cladogram should clearly show the branching pattern (A,(B,(C,(D,E)))). Species D and E should appear as sister taxa sharing Node 5. Species A should branch off at the base. All nodes and species must be clearly labelled.
15. Mutations are changes in the DNA sequence of an organism and are the ultimate source of all genetic variation in a population. [1] Most mutations are neutral or harmful, but some may be beneficial, providing a selective advantage in a particular environment. [1] Beneficial mutations are passed on to offspring through reproduction, and over generations, natural selection can increase their frequency in the population, leading to evolutionary change. [1]
Teaching note: Without mutations, there would be no new alleles for natural selection to act upon, and evolution could not occur. Mutations are random with respect to fitness — they do not arise because they are needed.
Section C: Data-Based and Extended Response [15 marks]
16. (a) The data suggest that chimpanzees are the most closely related to humans (0 amino acid differences), followed by the rhesus monkey (1 difference), horse (12 differences), chicken (13 differences), and tuna (21 differences). [1] The fewer the amino acid differences in cytochrome c, the more recently two species shared a common ancestor, indicating a closer evolutionary relationship. [1]
(b) Any one of the following limitations [1]:
- Convergent evolution can produce similar molecular sequences in unrelated species, leading to incorrect conclusions about relatedness.
- Different genes may evolve at different rates, so analysis of a single gene may not reflect the overall evolutionary relationship.
- Molecular clocks assume a constant rate of mutation, but mutation rates can vary over time and between lineages.
Expected visual features for Table 2: A clear two-column table with organisms listed in order of increasing amino acid differences from humans, with the correct numerical values.
17. (a) According to the biological species concept, a species is defined as a group of organisms that can interbreed and produce fertile offspring in nature. [1] Although the snails can mate in the laboratory, the offspring have low survival rates, indicating post-zygotic reproductive isolation. This suggests the two populations are in the process of speciating and may be considered incipient (emerging) separate species. [1]
(b) The mountain range acts as a geographic barrier that prevents gene flow between the east and west populations. [1] Over time, the two populations experience different environmental conditions (e.g., different predators, food sources, or microclimates), leading to different selection pressures. Natural selection favours different traits in each population (smooth vs. ridged shells), causing them to diverge genetically. [1]
18. Within a bacterial population, there is variation — some bacteria carry mutations that confer antibiotic resistance while others do not. [1] When the population is exposed to an antibiotic, the antibiotic acts as a selection pressure, killing non-resistant bacteria while resistant individuals survive. [1] The resistant bacteria reproduce, passing the resistance allele to their offspring. [1] Over successive generations, the frequency of the resistance allele increases in the population, and the population evolves to become predominantly resistant. [1]
Marking descriptors:
- 1 mark: Variation in resistance exists in the population
- 1 mark: Antibiotic acts as selection pressure
- 1 mark: Resistant bacteria survive and reproduce
- 1 mark: Frequency of resistance allele increases over generations
Teaching note: Antibiotic resistance is a real-world example of evolution by natural selection that occurs on a timescale observable in human lifetimes. It demonstrates all the key requirements: variation, selection, and inheritance.
19. (a) Disruptive selection (or diversifying selection). [1]
(b) The ancestral fish population was split when the lake divided into two ponds, creating geographic isolation and preventing gene flow. [1] In each pond, different food sources were available (large prey in Pond X, small invertebrates in Pond Y), creating different selection pressures. Natural selection favoured larger body size and robust jaws in Pond X and smaller body size with fine jaws in Pond Y. [1] Over many generations, genetic differences accumulated between the two populations. If the differences become great enough that individuals from the two ponds can no longer interbreed successfully (reproductive isolation), speciation will have occurred. [1]
Expected visual features for Fig. 3: The diagram should show the ancestral lake population splitting into two ponds with arrows indicating divergence. Morphological differences (body size, jaw structure) should be clearly labelled for each pond population.
20. Natural selection is the primary mechanism driving adaptive evolution. It occurs when individuals with advantageous traits have higher survival and reproductive success, causing allele frequencies to change in a non-random, directional manner. Natural selection is particularly important in large populations where its effects are more predictable and consistent. For example, the evolution of antibiotic resistance in bacteria demonstrates natural selection favouring resistant alleles under antibiotic pressure. [2]
Genetic drift is the random change in allele frequencies due to chance events. It is more significant in small populations, where chance events can have a large impact on allele frequencies. Examples include the bottleneck effect (a drastic reduction in population size, e.g., due to a natural disaster) and the founder effect (a small group establishes a new population with reduced genetic diversity). Genetic drift is non-adaptive — it does not necessarily lead to better-adapted populations. [2]
In large populations, natural selection is generally more important than genetic drift because the effects of chance are averaged out. In small populations, genetic drift can override natural selection, causing alleles to be lost or fixed regardless of their fitness effects. Both processes contribute to evolution, but their relative importance depends on population size.
Marking descriptors:
- 1 mark: Clear explanation of natural selection with an example
- 1 mark: Clear explanation of genetic drift with reference to population size and an example
- 1 mark: Comparison of the relative importance in large vs. small populations
- 1 mark: Coherent discussion with appropriate biological terminology
Total: 50 marks
Free quiz and exam paper access
Enter your details to view this paper
Your access is remembered on this device.