AI Generated Quiz
A Level H1 Biology Ecology Quiz
Free A Level H1 Biology Ecology quiz, LongCat AI version, with questions, answers, and A Level-style practice for Singapore students.
These static practice materials are generated from the site's syllabus and paper-generation workflow, with source and model context shown so students and parents can evaluate the material before use.
Questions
A-Level Biology H1 Quiz - Ecology
Name: _______________________
Class: _______________________
Date: _______________________
Score: _______ / 60
Duration: 60 minutes
Total Marks: 60
Instructions:
- Answer ALL questions in the spaces provided.
- The number of marks for each question is shown in brackets [ ].
- You are advised to spend no more than 60 minutes on this quiz.
- Where a question requires an explanation, use clear biological terminology and refer to specific data or examples where appropriate.
- For questions involving calculations, show all working and include units where applicable.
Section A: Multiple Choice Questions (Questions 1–5)
Answer ALL questions. Each question carries 2 marks.
1. Which of the following best describes a population in ecological terms?
A. All the living organisms in a forest
B. All the oak trees in a woodland
C. All the oak trees and squirrels in a woodland
D. All the biotic and abiotic factors in a lake
2. A student measures the distribution of dandelions in a field using quadrats. Which sampling method would be most appropriate if the dandelions are distributed along a gradient from a path into the field?
A. Random sampling only
B. Systematic sampling along a transect
C. Random sampling with a large number of quadrats
D. Opportunistic sampling near the path
3. The table below shows the number of individuals of four species in two communities.
| Species | Community X | Community Y |
|---|---|---|
| A | 50 | 25 |
| B | 30 | 25 |
| C | 15 | 25 |
| D | 5 | 25 |
Which statement is correct?
A. Community X has a higher species richness than Community Y.
B. Community Y has a higher species evenness than Community X.
C. Community X has a higher Simpson's Index of Diversity than Community Y.
D. Both communities have the same species richness and evenness.
4. During primary succession on bare rock, which of the following organisms is most likely to be a pioneer species?
A. Oak tree
B. Lichen
C. Grass
D. Shrub
5. In a food chain: grass → grasshopper → frog → snake → hawk, approximately what percentage of the energy fixed by the grass is available to the hawk?
A. 0.01%
B. 0.1%
C. 1%
D. 10%
Section B: Structured Questions (Questions 6–15)
Answer ALL questions.
6. Define the following ecological terms:
(a) Habitat [1]
(b) Niche [1]
(c) Carrying capacity [1]
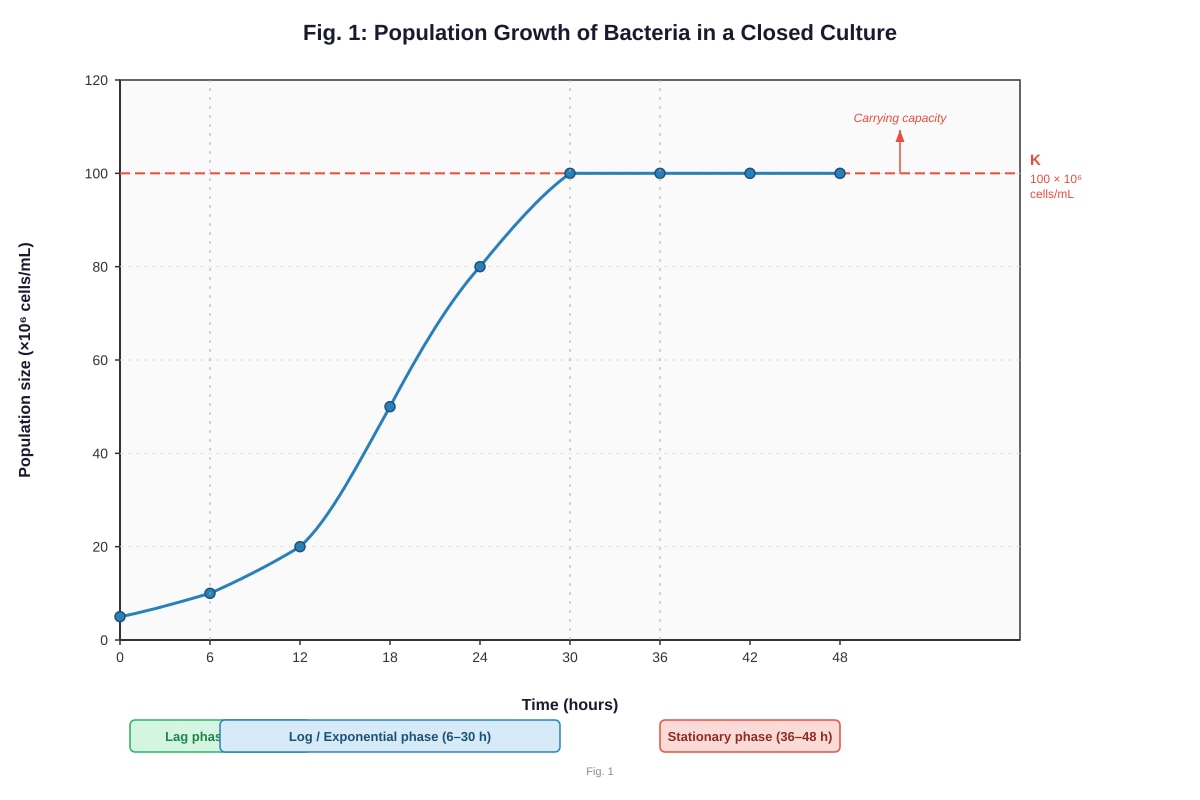
7. Fig. 1 shows the population growth of a species of bacteria in a closed culture over 48 hours.
Generated graph for Q7.
(a) With reference to Fig. 1, identify the phase of growth between hours 6 and 30. [1]
(b) State the approximate carrying capacity of the culture. [1]
(c) Explain why the population growth slows after hour 30. [2]
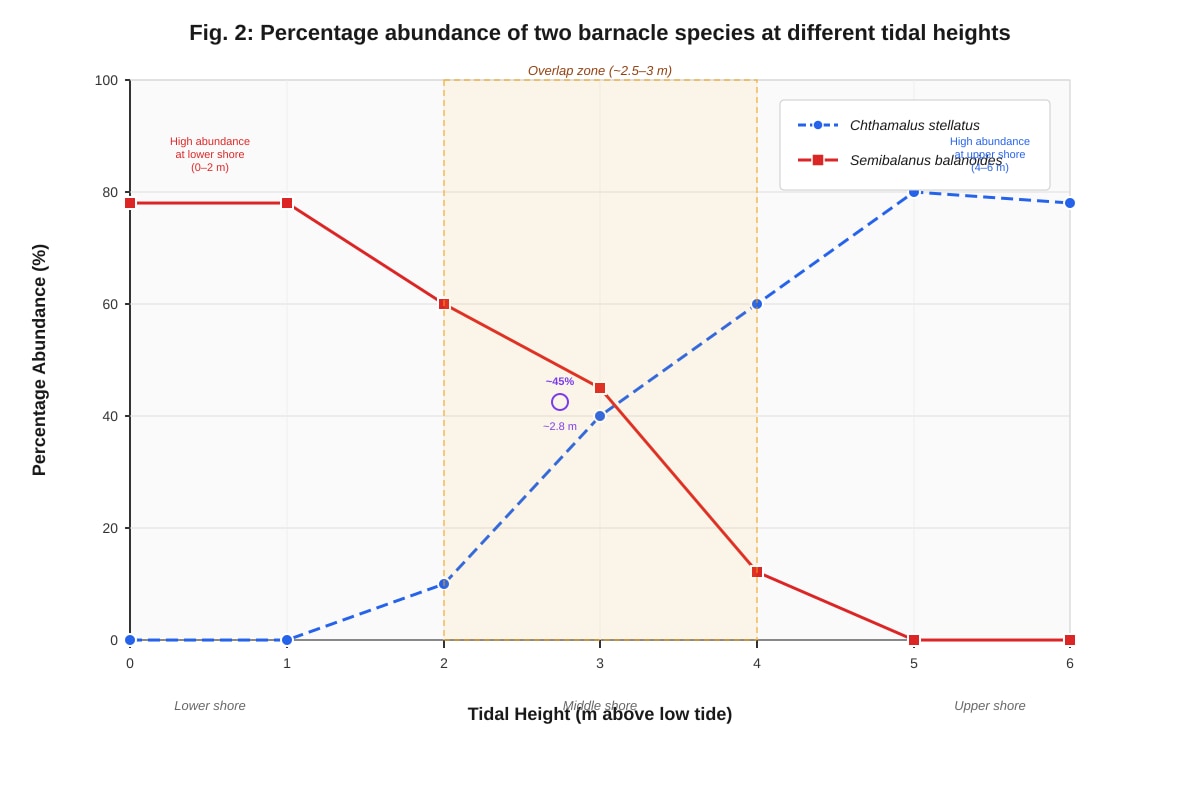
8. A study was carried out to investigate the abundance of two species of barnacle, Chthamalus stellatus and Semibalanus balanoides, on a rocky shore. The results are shown in Fig. 2.
Generated graph for Q8.
(a) Describe the distribution pattern of Chthamalus stellatus shown in Fig. 2. [2]
(b) Suggest one abiotic factor that could explain the distribution of Semibalanus balanoides at the lower shore. [1]
(c) Explain how competition between the two species could account for the observed distribution patterns. [3]
9. Explain the role of decomposers in the carbon cycle. Include reference to the processes of decomposition and respiration in your answer. [4]
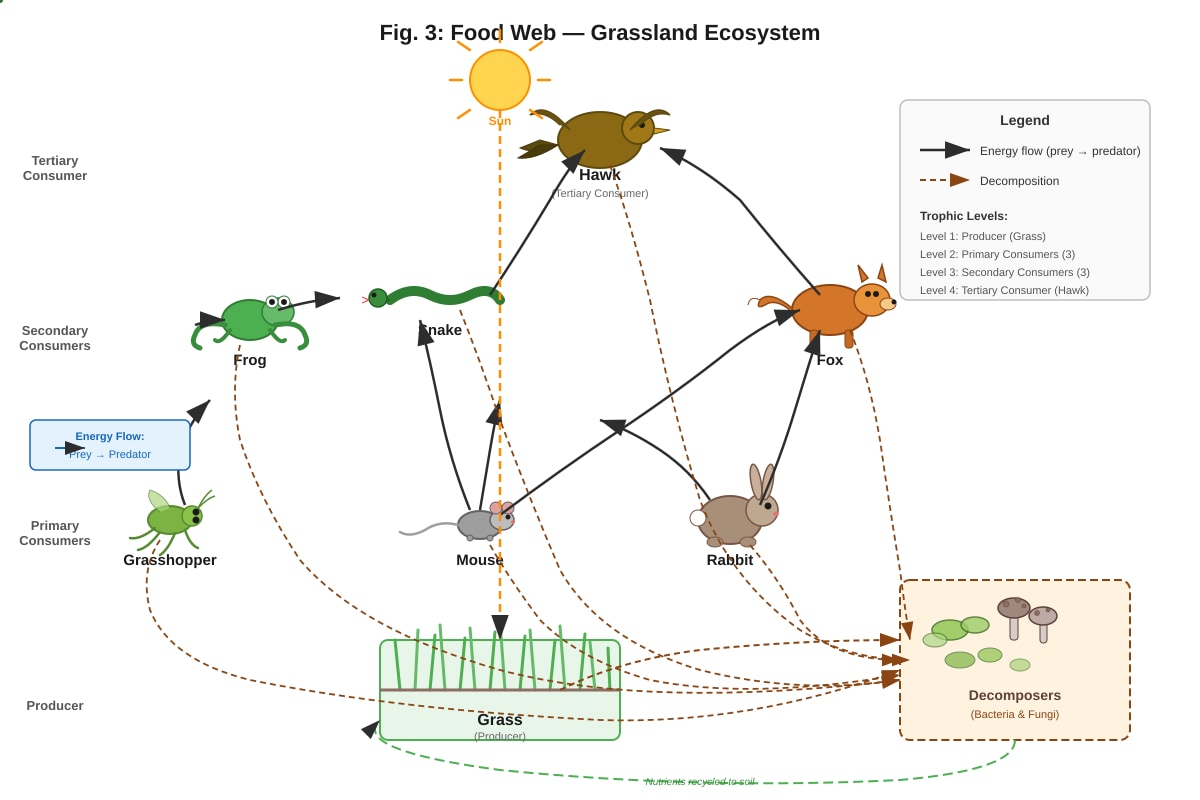
10. A food web from a grassland ecosystem is shown in Fig. 3.
Generated diagram for Q10.
(a) Identify the tertiary consumer in the food web. [1]
(b) State the trophic level of the mouse. [1]
(c) If the grass contains 50,000 kJ of energy, calculate the approximate energy available to the hawk. Show your working. [2]
(d) Explain why food webs are more stable than simple food chains. [2]
11. Describe how you would use quadrats to estimate the population density of daisies in a meadow. Include in your answer:
- how you would decide on quadrat size
- how you would place the quadrats
- how you would calculate population density [4]
12. Distinguish between primary succession and secondary succession. Give one example of where each type of succession occurs. [3]
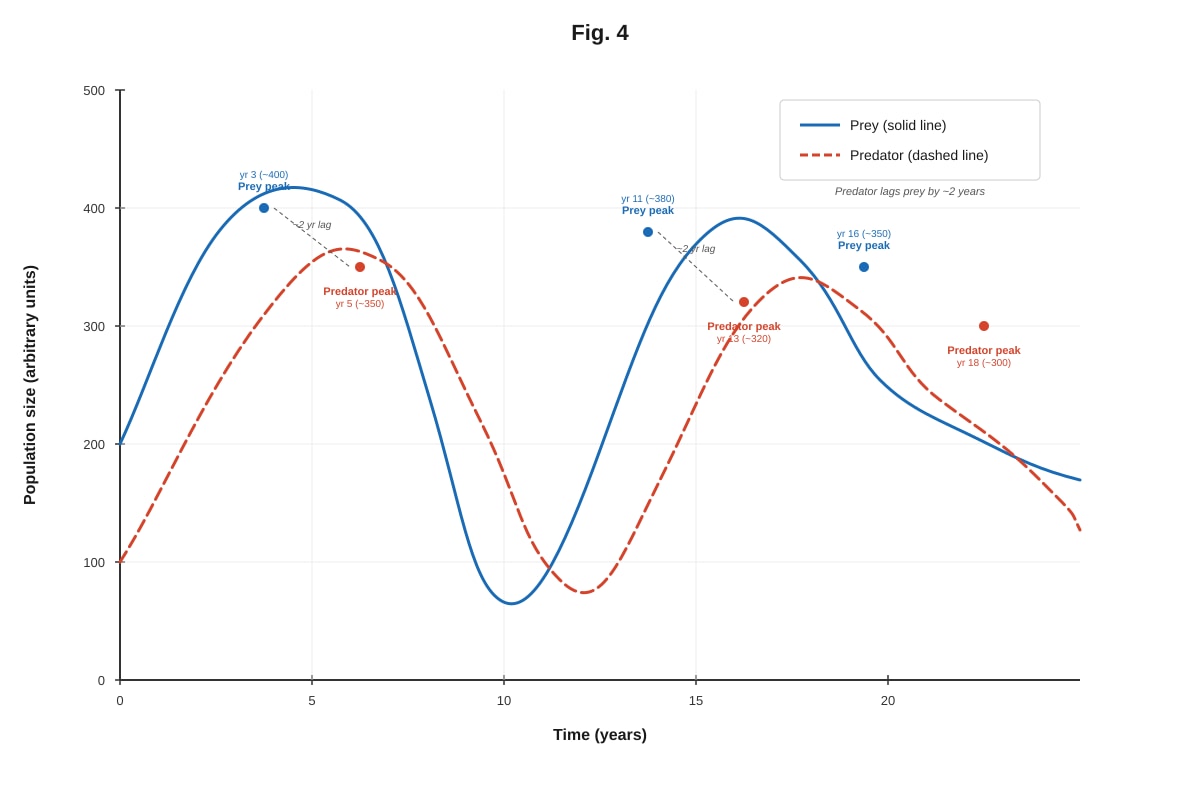
13. Fig. 4 shows the change in population size of a prey species and its predator over time.
Generated graph for Q13.
(a) Describe the relationship between the predator and prey populations shown in Fig. 4. [2]
(b) Explain why the predator population peaks after the prey population. [2]
(c) Suggest what would happen to the predator population if the prey population suddenly decreased to zero. [1]
14. Explain how energy is lost between trophic levels in a food chain. Include at least three distinct reasons. [3]
15. A farmer applies nitrogen-containing fertiliser to a field. Describe the likely effects of excess fertiliser on the surrounding aquatic ecosystem. [3]
Section C: Data-Based and Extended Response Questions (Questions 16–20)
Answer ALL questions.
16. Table 1 shows the species richness and abundance of insects sampled in two forest areas: an undisturbed primary forest and a logged secondary forest.
Table 1
| Insect Order | Primary Forest (number of species) | Primary Forest (total individuals) | Secondary Forest (number of species) | Secondary Forest (total individuals) |
|---|---|---|---|---|
| Coleoptera (beetles) | 45 | 1,200 | 22 | 800 |
| Lepidoptera (butterflies/moths) | 38 | 950 | 15 | 400 |
| Hymenoptera (ants/bees) | 52 | 2,100 | 30 | 1,500 |
| Diptera (flies) | 35 | 1,800 | 28 | 2,200 |
| Orthoptera (grasshoppers) | 12 | 300 | 8 | 250 |
| Total | 182 | 6,350 | 103 | 5,150 |
(a) Calculate the species richness for each forest type. [1]
(b) Which forest type has the higher species evenness? Explain your answer. [2]
(c) Suggest two reasons why the primary forest has greater species richness than the secondary forest. [2]
(d) A student concludes that logging has no effect on insect diversity. Evaluate this conclusion using the data in Table 1. [2]
17. Read the following passage and answer the questions that follow.
Coral reefs are among the most biodiverse ecosystems on Earth, supporting approximately 25% of all marine species despite covering less than 1% of the ocean floor. Corals form a mutualistic relationship with zooxanthellae, photosynthetic dinoflagellates that live within the coral tissues. The zooxanthellae provide the coral with organic compounds produced by photosynthesis, while the coral provides the algae with a protected environment and access to sunlight. When water temperatures rise above the coral's tolerance threshold, the zooxanthellae are expelled, leading to coral bleaching. Without their symbiotic algae, corals lose their main energy source and may die if conditions do not return to normal.
(a) Define the term mutualism and explain how the relationship between coral and zooxanthellae is an example of mutualism. [3]
(b) Explain the process of coral bleaching and its consequences for the reef ecosystem. [3]
(c) Suggest two ways in which climate change could further threaten coral reef ecosystems beyond bleaching. [2]
18. Fig. 5 shows the nitrogen cycle in a terrestrial ecosystem.
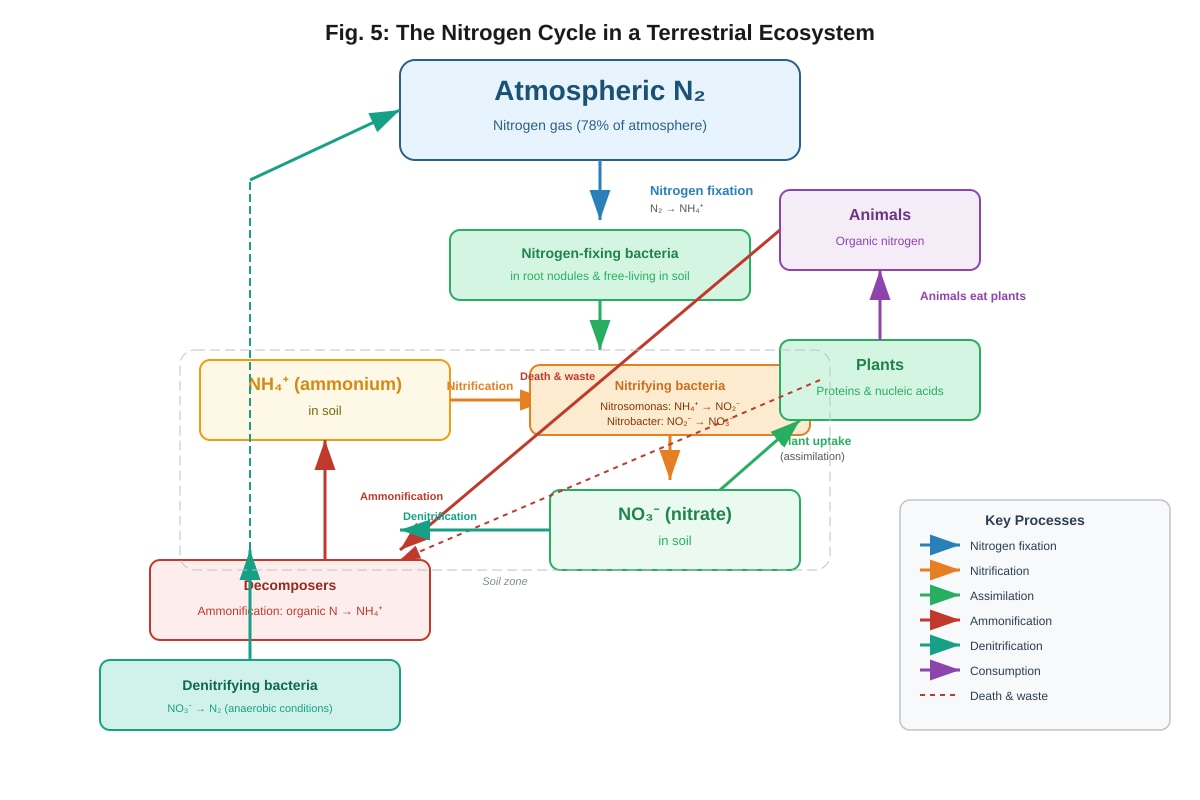
Generated diagram for Q18.
(a) With reference to Fig. 5, name the process by which atmospheric nitrogen is converted into a form usable by plants. [1]
(b) Name the type of bacteria responsible for nitrification. [1]
(c) Explain the role of decomposers in the nitrogen cycle. [2]
(d) Describe how the use of nitrogen-containing fertilisers by farmers can lead to eutrophication of nearby water bodies. [3]
19. A conservation programme was established to protect an endangered species of sea turtle. The programme included: protecting nesting beaches from human disturbance, reducing bycatch in fishing nets through the use of turtle excluder devices (TEDs), and captive breeding and release of hatchlings.
(a) Explain why protecting nesting beaches is important for the survival of sea turtle populations. [2]
(b) Evaluate the effectiveness of captive breeding as a conservation strategy. [3]
(c) Suggest one additional conservation measure that could be implemented to protect sea turtles. [1]
20. Discuss the impact of human activities on biodiversity. In your answer, refer to at least three different human activities and explain how each affects ecosystems and species diversity. [6]
Answers
A-Level Biology H1 Quiz - Ecology
Answer Key and Marking Scheme
Section A: Multiple Choice Questions (Questions 1–5)
1. B [2]
A population is defined as a group of organisms of the same species living in the same area at the same time. Option B correctly identifies a single species (oak trees) in a defined area (woodland). Option A describes a community (multiple species). Option C also describes a community. Option D describes an ecosystem (biotic + abiotic factors).
Common mistake: Confusing population with community. Remember that a population is species-specific.
2. B [2]
When organisms are distributed along an environmental gradient (e.g., distance from a path), systematic sampling along a transect is the most appropriate method. A transect is a line placed across the gradient, and quadrats are placed at regular intervals along it. This ensures that the full range of the gradient is sampled. Random sampling (A, C) may miss the gradient pattern. Opportunistic sampling (D) is biased and unscientific.
Key concept: Transect sampling is used when there is an environmental gradient; random sampling is used when the habitat is uniform.
3. B [2]
Species richness (number of species) is the same for both communities (4 species each), so A is incorrect. Species evenness refers to how evenly individuals are distributed among species. In Community Y, all four species have exactly 25 individuals (perfect evenness), whereas in Community X, the distribution is very uneven (50, 30, 15, 5). Therefore, Community Y has higher species evenness. Simpson's Index would be higher for Community Y, not X, so C is incorrect. D is incorrect because evenness differs.
Key concept: Species richness = number of species; species evenness = relative abundance of each species.
4. B [2]
Lichens are classic pioneer species in primary succession on bare rock. They can colonise bare rock because they do not require soil — they secrete acids that slowly break down the rock to form soil. Grasses (C) and shrubs (D) require some soil and appear later. Oak trees (A) are late-successional (climax community) species.
Key concept: Pioneer species are the first to colonise a new or barren environment. Lichens are the typical pioneer on bare rock.
5. A [2]
The hawk is at the 5th trophic level (grass = 1st, grasshopper = 2nd, frog = 3rd, snake = 4th, hawk = 5th). With approximately 10% energy transfer between each trophic level, the energy available to the hawk = 100% × 0.1 × 0.1 × 0.1 × 0.1 × 0.1 = 0.01%.
Calculation: 0.1^4 = 0.0001 = 0.01% (four transfers from producer to top consumer). Common mistake: forgetting that the first trophic level is the producer, so the hawk at the 5th level involves 4 energy transfers.
Section B: Structured Questions (Questions 6–15)
6.
(a) Habitat [1]: The place or environment where an organism normally lives. It includes the physical and biological conditions of that location.
(b) Niche [1]: The role or function of an organism within its ecosystem, including its interactions with other organisms and its use of resources (what it eats, where it lives, how it reproduces, etc.).
(c) Carrying capacity [1]: The maximum population size of a species that an environment can sustain indefinitely, given the available resources (food, water, space, etc.).
Key distinction: A habitat is WHERE an organism lives; a niche is HOW it lives (its role).
7.
(a) Log phase (exponential phase) [1]
The population increases rapidly in a characteristic exponential (J-shaped) curve between hours 6 and 30.
(b) Approximately 100 × 10⁶ cells/mL [1]
The carrying capacity (K) is the maximum population size the environment can sustain, shown by the horizontal asymptote of the curve.
(c) [2 marks]
The population growth slows because:
- Resources (nutrients, oxygen) become limited as the population increases [1]
- Waste products accumulate, creating unfavourable conditions [1]
- The population has reached the carrying capacity of the environment, so the birth rate equals the death rate [1]
(Award 2 marks for any two valid points)
Key concept: In a closed system, logistic growth occurs because resources are finite. The stationary phase reflects the carrying capacity.
8.
(a) [2 marks]
Chthamalus stellatus is found predominantly in the upper shore region (4–6 m above low tide) [1], where it has high abundance (~80–90%), and is absent or very rare at the lower shore (0–2 m) [1].
(b) [1 mark]
Desiccation tolerance / exposure to air — Semibalanus balanoides is less able to tolerate prolonged exposure to air and desiccation, so it is restricted to the lower shore where it is submerged for longer periods. (Alternatively: competition with Chthamalus in the upper shore; wave action tolerance.)
(c) [3 marks]
- Both species compete for space (and possibly food) on the rocky shore [1]
- Chthamalus is better adapted to the upper shore conditions (greater desiccation tolerance) and outcompetes Semibalanus in this zone [1]
- Semibalanus is better adapted to the lower shore (greater competitive ability in submerged conditions) and outcompetes Chthamalus in this zone [1]
- The overlap zone at ~2.5–3 m represents the area where neither species has a clear competitive advantage [1]
(Award 3 marks for a coherent explanation covering competition, adaptation, and the overlap zone)
Key concept: Competitive exclusion principle — two species with identical niches cannot coexist indefinitely. The observed zonation reflects competitive outcomes along an environmental gradient.
9. [4 marks]
Decomposers (bacteria and fungi) play a critical role in the carbon cycle:
- They break down dead organic matter (dead organisms, faeces, leaf litter) through the process of decomposition [1]
- During decomposition, they release carbon-containing compounds from dead tissues back into the soil and atmosphere [1]
- Decomposers carry out cellular respiration, releasing carbon dioxide (CO₂) into the atmosphere as a by-product [1]
- This returns carbon to the atmosphere, making it available again for photosynthesis by producers, thus completing the carbon cycle [1]
Key concept: Without decomposers, carbon would remain locked in dead organic matter and the cycle would stop. Decomposers are essential for nutrient recycling.
10.
(a) Hawk [1]
The hawk feeds on secondary consumers (snake and fox), placing it at the fourth trophic level (tertiary consumer).
(b) Primary consumer / 2nd trophic level [1]
The mouse feeds on grass (producer), so it is a primary consumer.
(c) [2 marks]
- Grass (producer) = Trophic level 1: 50,000 kJ
- Mouse (primary consumer) = Trophic level 2: 50,000 × 0.1 = 5,000 kJ
- Fox/Snake (secondary consumer) = Trophic level 3: 5,000 × 0.1 = 500 kJ
- Hawk (tertiary consumer) = Trophic level 4: 500 × 0.1 = 50 kJ [1]
Working: 50,000 × 0.1³ = 50,000 × 0.001 = 50 kJ [1]
(d) [2 marks] - Food webs contain multiple interconnected food chains, providing alternative pathways for energy flow [1]
- If one species is removed or declines, consumers can switch to alternative food sources, maintaining ecosystem stability [1]
- This redundancy reduces the risk of ecosystem collapse compared to a single linear food chain [1]
(Award 2 marks for any two valid points)
Key concept: Food webs are more resilient because they have multiple feeding relationships. The loss of one species has less impact when alternatives exist.
11. [4 marks]
- Quadrat size: Use a quadrat of appropriate size for the organism — for daisies, a 1 m × 1 m quadrat would be suitable, as daisies are small but visible plants [1]
- Placement: Place quadrats randomly across the meadow using a random number generator to determine coordinates, or use a transect if there is a known environmental gradient. Place at least 10–20 quadrats to ensure representative sampling [1]
- Counting: Count the number of individual daisy plants within each quadrat [1]
- Calculation: Population density = (Total number of daisies counted across all quadrats) ÷ (Total area sampled = number of quadrats × area of one quadrat). Express as individuals per m² [1]
Key concept: Random sampling avoids bias. The more quadrats used, the more reliable the estimate. Population density = total count / total area sampled.
12. [3 marks]
- Primary succession occurs on newly formed or exposed land where no soil or previous biological community existed (e.g., bare rock, volcanic islands, sand dunes) [1]
- Secondary succession occurs where an existing community has been disturbed or removed but soil remains (e.g., after a forest fire, abandoned farmland, cleared woodland) [1]
- Secondary succession is generally faster than primary succession because soil is already present and contains nutrients and seeds [1]
Key distinction: Primary = no soil initially; Secondary = soil already present. Primary succession takes much longer because soil must first be formed.
13.
(a) [2 marks]
The predator and prey populations show cyclical oscillations [1] where the predator population consistently lags behind (peaks after) the prey population [1].
(b) [2 marks]
- When prey population increases, there is more food available for predators, so predator reproduction and survival increase [1]
- However, there is a time delay before the predator population responds (gestation period, time to reach reproductive maturity), so the predator peak occurs after the prey peak [1]
- As predators increase, they consume more prey, causing the prey population to decline, which then leads to a decline in predators due to food shortage [1]
(Award 2 marks for a clear explanation of the time lag and causal relationship)
(c) [1 mark]
The predator population would decline rapidly and potentially go extinct (or migrate) due to lack of food.
Key concept: Predator-prey cycles are driven by time-delayed feedback. The predator curve always lags behind the prey curve.
14. [3 marks]
Energy is lost between trophic levels due to:
- Respiration: Organisms use energy for metabolic processes (movement, homeostasis, reproduction), which is lost as heat [1]
- Incomplete consumption: Not all of the lower trophic level is eaten (e.g., roots, bones, fur) [1]
- Inegestible/indigestible material: Some consumed material is egested as faeces (e.g., cellulose in herbivores) and is not assimilated [1]
- Excretion: Energy-containing waste products (e.g., urea) are excreted [1]
(Award 3 marks for any three valid reasons)
Key concept: Only ~10% of energy is transferred between trophic levels. The rest is lost primarily as heat through respiration. This limits the number of trophic levels in a food chain (typically 4–5).
15. [3 marks]
- Excess fertiliser is washed into nearby water bodies by rain (runoff) [1]
- The high nitrogen content promotes rapid growth of algae (algal bloom) [1]
- When the algae die, decomposers break them down, using up dissolved oxygen in the water [1]
- This leads to eutrophication — oxygen depletion that kills fish and other aquatic organisms [1]
(Award 3 marks for a coherent chain of events: runoff → algal bloom → decomposition → oxygen depletion → death of aquatic organisms)
Key concept: Eutrophication is nutrient enrichment of water bodies leading to oxygen depletion. It is a major consequence of agricultural runoff.
Section C: Data-Based and Extended Response Questions (Questions 16–20)
16.
(a) [1 mark]
- Primary forest species richness = 182 species
- Secondary forest species richness = 103 species
(Award 1 mark for both correct values)
(b) [2 marks]
The secondary forest has higher species evenness [1]. In the secondary forest, the total individuals (5,150) are distributed across 103 species (~50 individuals per species on average), whereas in the primary forest, 6,350 individuals are distributed across 182 species (~35 per species), but the distribution is more uneven (e.g., Hymenoptera has 2,100 individuals while Orthoptera has only 300). The secondary forest shows a more even spread relative to its species count [1].
(Accept alternative valid reasoning based on the data)
(c) [2 marks]
Two reasons: - The primary forest has greater habitat diversity (more niches) due to a more complex vegetation structure (canopy layers, understory, leaf litter) [1]
- The primary forest has not been disturbed by logging, so species have had longer to establish and colonise [1]
- The primary forest has more stable microclimates and greater resource availability [1]
(Award 2 marks for any two valid reasons)
(d) [2 marks]
The student's conclusion is not supported by the data [1]. The data clearly show that the secondary forest has lower species richness (103 vs. 182 species) and lower total abundance (5,150 vs. 6,350 individuals), indicating that logging has had a significant negative impact on insect diversity [1].
Key concept: Species richness is a direct measure of diversity. The data provide clear evidence that logging reduces insect species richness.
17.
(a) [3 marks]
- Mutualism is a type of symbiotic relationship in which both species benefit from the interaction [1]
- The zooxanthellae benefit by receiving a protected environment within the coral tissues and access to sunlight for photosynthesis [1]
- The coral benefits by receiving organic compounds (e.g., glucose, glycerol) produced by the zooxanthellae through photosynthesis, which provide energy for the coral [1]
(b) [3 marks] - Coral bleaching occurs when water temperatures rise above the coral's tolerance threshold [1]
- The coral expels its symbiotic zooxanthellae, causing the coral to turn white (the calcium carbonate skeleton becomes visible) [1]
- Without zooxanthellae, the coral loses its main energy source and may die if temperatures do not return to normal, leading to the collapse of the reef ecosystem and loss of habitat for reef-dependent species [1]
(c) [2 marks]
Two ways climate change threatens coral reefs beyond bleaching: - Ocean acidification: Increased CO₂ dissolves in seawater, lowering pH and reducing the availability of carbonate ions needed for coral skeleton formation [1]
- Rising sea levels: May reduce light penetration to deeper reefs, limiting photosynthesis by zooxanthellae [1]
- Increased storm intensity: More frequent and severe storms can physically damage reef structures [1]
(Award 2 marks for any two valid points)
Key concept: Coral-zooxanthellae mutualism is temperature-sensitive. Climate change threatens reefs through multiple mechanisms.
18.
(a) Nitrogen fixation [1]
(b) Nitrifying bacteria (specifically Nitrosomonas and Nitrobacter) [1]
(c) [2 marks]
- Decomposers break down dead organic matter and waste products [1]
- They convert organic nitrogen (proteins, nucleic acids) back into ammonium ions (NH₄⁺) through ammonification, making nitrogen available for nitrification and reuse by plants [1]
(d) [3 marks] - Excess nitrogen fertiliser is washed into water bodies by rainwater runoff [1]
- The high nitrogen concentration promotes excessive growth of algae (algal bloom) on the water surface [1]
- When the algae die, decomposers break them down, consuming large amounts of dissolved oxygen, leading to hypoxia and death of fish and other aquatic organisms (eutrophication) [1]
Key concept: The nitrogen cycle depends on bacteria. Human activities (fertiliser use) can disrupt the cycle and cause eutrophication.
19.
(a) [2 marks]
- Nesting beaches are where female turtles lay eggs; disturbance can prevent nesting or destroy eggs [1]
- Protecting beaches ensures successful reproduction and maintains the population's reproductive rate, which is essential for population recovery [1]
(b) [3 marks]
Advantages of captive breeding: - Can rapidly increase population numbers in a controlled environment [1]
- Protects eggs and hatchlings from predators and environmental threats [1]
Limitations of captive breeding:
- Captive-bred animals may lack survival skills needed in the wild (foraging, predator avoidance) [1]
- Genetic diversity may be reduced if the captive population is small, leading to inbreeding depression [1]
- It is expensive and does not address the root causes of population decline (habitat loss, bycatch) [1]
(Award up to 3 marks for a balanced evaluation covering both strengths and limitations)
(c) [1 mark]
One additional measure: - Establishing marine protected areas (MPAs) where fishing is restricted [1]
- Reducing plastic pollution in oceans (turtles mistake plastic bags for jellyfish) [1]
- Regulating coastal development to preserve nesting habitats [1]
(Award 1 mark for any valid suggestion)
Key concept: Effective conservation requires addressing both direct threats (bycatch) and indirect threats (habitat loss, pollution). Captive breeding alone is insufficient.
20. [6 marks]
Discuss the impact of human activities on biodiversity.
Human activities have significantly reduced biodiversity through multiple mechanisms:
1. Habitat destruction and fragmentation [2]
- Deforestation, urbanisation, and agriculture destroy natural habitats, directly eliminating species that depend on them [1]
- Habitat fragmentation isolates populations, reducing gene flow and increasing extinction risk [1]
2. Pollution [2]
- Chemical pollution (pesticides, heavy metals, industrial waste) contaminates soil and water, poisoning organisms and disrupting food chains [1]
- Plastic pollution harms marine life through ingestion and entanglement; eutrophication from agricultural runoff depletes oxygen in aquatic ecosystems [1]
3. Overexploitation [2]
- Overfishing, hunting, and harvesting of species at rates faster than they can reproduce leads to population decline and extinction [1]
- Examples include the overfishing of cod in the North Atlantic and the poaching of elephants for ivory [1]
4. Climate change (bonus point) [1]
- Rising temperatures, changing rainfall patterns, and ocean acidification alter habitats faster than many species can adapt [1]
- Coral bleaching, polar ice loss, and shifting species distributions are direct consequences [1]
5. Introduction of invasive species (bonus point) [1]
- Non-native species introduced by humans can outcompete, prey on, or bring diseases to native species [1]
- Example: the introduction of the brown tree snake to Guam led to the extinction of several native bird species [1]
Marking descriptors:
- 5–6 marks: Comprehensive discussion covering at least three human activities with clear explanations of their impacts on ecosystems and species diversity. Well-structured with specific examples.
- 3–4 marks: Adequate discussion covering two to three activities with some explanation of impacts. May lack specific examples or depth.
- 1–2 marks: Limited discussion with vague or generic statements. May only list activities without explaining impacts.
- 0 marks: No relevant content.
Key concept: Human activities are the primary driver of the current biodiversity crisis. Conservation requires addressing multiple interconnected threats.
Free quiz and exam paper access
Enter your details to view this paper
Your access is remembered on this device.