AI Generated Quiz
A Level H1 Biology Ecology Quiz
Free A Level H1 Biology Ecology quiz, AI version, with questions, answers, and A Level-style practice for Singapore students.
These static practice materials are generated from the site's syllabus and paper-generation workflow, with source and model context shown so students and parents can evaluate the material before use.
Questions
Free quiz and exam paper access
Enter your details to view this paper
Your access is remembered on this device.
Answers
A-Level Biology H1 Quiz - Ecology: Answer Key
Total Marks: 50
Section A: Multiple-Choice Questions (Questions 1–5, 1 mark each)
1. B) All the organisms of the same species living in a particular area at the same time
- Marks: 1
- Explanation: A population is defined as a group of organisms of the same species that live in the same area at the same time and can interbreed. Option A describes a community (different species in an area). Option C describes an ecosystem (community + abiotic environment). Option D describes species richness or biodiversity, not a population.
- Common mistake: Confusing population with community. Remember: population = one species; community = multiple species.
2. B) An increase in the population of primary consumers
- Marks: 1
- Explanation: When a top predator is removed, the organisms it directly preys upon (typically primary consumers or secondary consumers) experience reduced predation pressure. This leads to an increase in their population size. The effect is called a trophic cascade.
- Common mistake: Choosing "decrease in producers." While producers may eventually decrease due to increased grazing by the larger primary consumer population, the immediate effect is on the primary consumer population itself.
3. B) Denitrification
- Marks: 1
- Explanation: Denitrification is the process by which denitrifying bacteria convert nitrates () in the soil into nitrogen gas (), which is released into the atmosphere. This completes the nitrogen cycle.
- Common mistake: Confusing denitrification with nitrogen fixation. Nitrogen fixation converts atmospheric into ammonia (), while denitrification does the reverse.
- Key definitions:
- Nitrification: conversion of ammonia to nitrites then nitrates (by nitrifying bacteria)
- Nitrogen fixation: conversion of atmospheric to ammonia (by nitrogen-fixing bacteria)
- Ammonification: conversion of organic nitrogen to ammonia (by decomposers)
4. B) The maximum population size that an environment can sustain indefinitely
- Marks: 1
- Explanation: Carrying capacity (K) is the maximum population size that an environment can support indefinitely given the available resources (food, water, shelter, etc.). When a population exceeds carrying capacity, resources become limiting and the population declines.
- Common mistake: Confusing carrying capacity with intrinsic rate of increase. The intrinsic rate of increase (r) is the maximum growth rate under ideal conditions, not the carrying capacity.
5. C) A volcanic eruption
- Marks: 1
- Explanation: Density-independent factors affect population size regardless of population density. These include natural disasters (volcanic eruptions, floods, fires), weather extremes, and human activities. Density-dependent factors (competition, predation, disease) have effects that intensify as population density increases.
- Common mistake: Choosing "spread of a contagious disease." Disease spread is density-dependent because it spreads more rapidly in dense populations.
Section B: Short-Structured Questions (Questions 6–10)
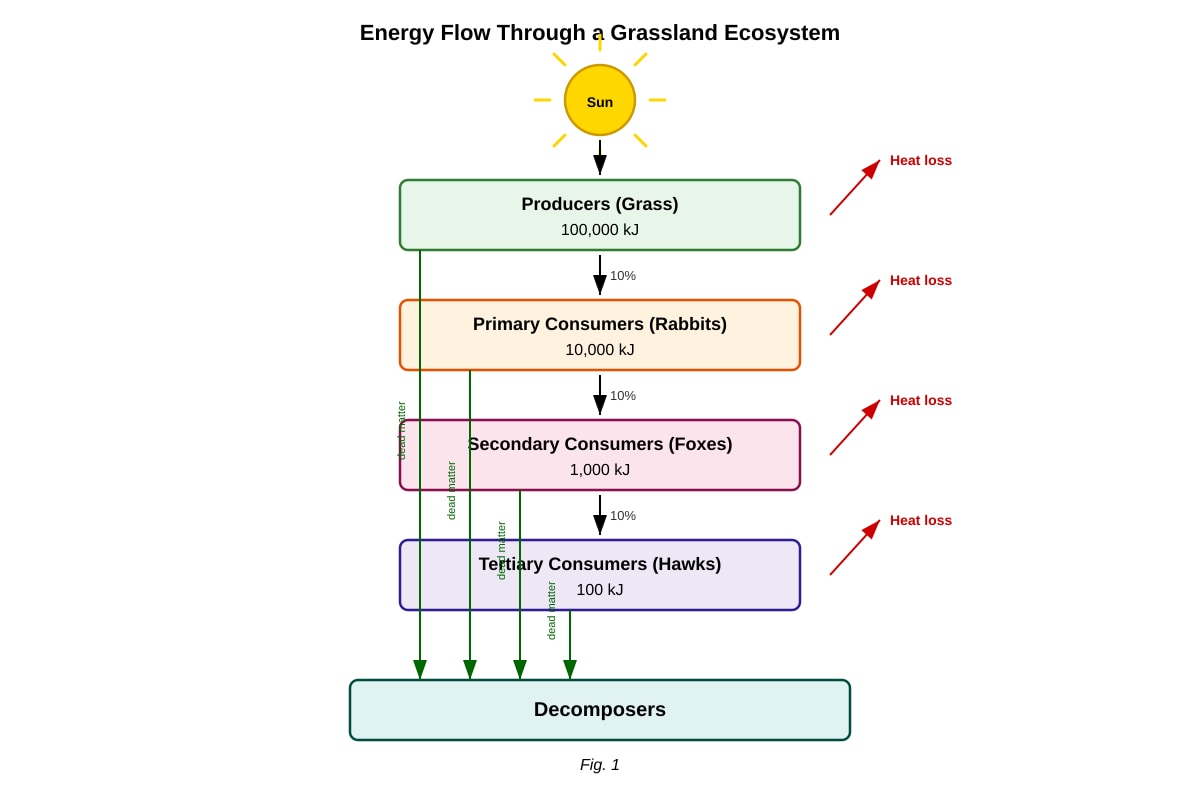
6. Energy flow through a grassland ecosystem
(a) Percentage of energy transferred from producers to primary consumers [1]
- Answer:
- Marks: 1 for correct calculation and answer.
- Method: Energy transfer efficiency = (energy at higher trophic level ÷ energy at lower trophic level) × 100.
(b) Why energy decreases at each trophic level [2]
- Answer:
- Not all of the organism is consumed/eaten by the next trophic level (e.g., roots, bones, fur are not eaten). [1]
- Energy is lost as heat through respiration (metabolic processes), and some energy is lost in excretion and egestion (waste products). [1]
- Marks: 2 marks for two valid reasons.
- Teaching note: Energy transfer between trophic levels is typically only about 10% efficient. The rest is lost through:
- Not all biomass being consumed
- Energy lost as heat during respiration
- Energy lost in waste products (urine, faeces)
7. Plant distribution along a sand dune transect
(a) Describe the trend [2]
- Answer: The percentage cover of the plant increases from 0% at 0 m to a peak of 60% at 15 m from the sea, then decreases to 5% at 30 m. [2]
- Marks: 1 mark for describing the increase to a peak, 1 mark for describing the subsequent decrease.
- Teaching note: A good description should mention the direction of change, the peak value and location, and the overall pattern.
(b) Suggest one abiotic factor explaining low cover at 0 m [1]
- Answer: Any one of:
- High salinity (salt spray from the sea)
- Sand instability/movement
- Low water availability (drought conditions)
- High wind exposure
- Low nutrient availability
- Marks: 1 for a valid abiotic factor.
- Teaching note: At 0 m (closest to the sea), conditions are harshest: salt spray, sand burial, wind exposure, and poor water retention make it difficult for most plants to establish.
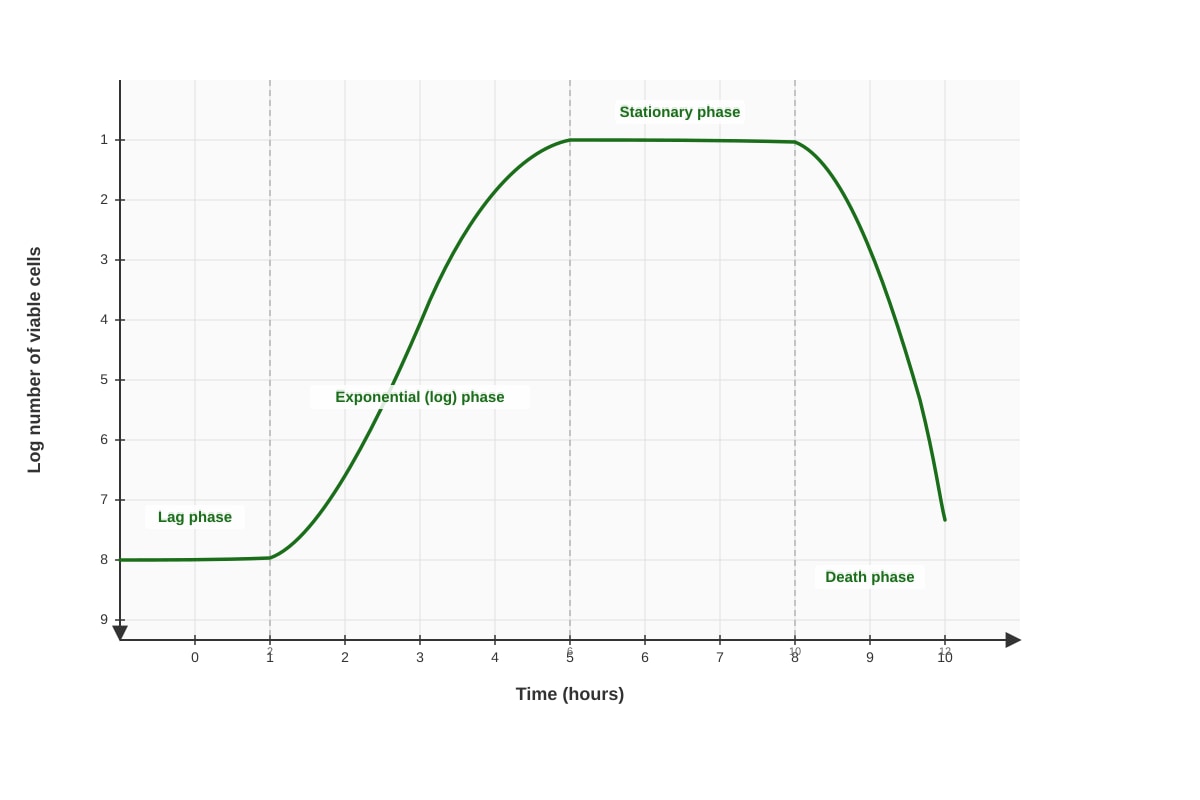
8. Bacterial growth curve
(a) Phase where cell division equals cell death [1]
- Answer: Stationary phase
- Marks: 1
- Teaching note: In the stationary phase, the rate of cell division equals the rate of cell death, so the viable cell count remains constant. This occurs when resources become limiting or waste products accumulate.
(b) Why the population enters the death phase [2]
- Answer:
- Nutrients in the culture medium become depleted/exhausted. [1]
- Toxic waste products (e.g., metabolic by-products) accumulate to lethal levels. [1]
- Marks: 2 marks for two valid reasons.
- Teaching note: In a closed culture, there is no addition of fresh nutrients or removal of waste. As the population grows, nutrients are used up and waste products accumulate, eventually causing the death rate to exceed the birth rate.
9. Simpson's Index of Diversity
(a) Calculate Simpson's Index [3]
- Answer:
- Total individuals,
- Marks: 1 mark for correct , 1 mark for correct calculation of , 1 mark for correct final answer (0.22).
- Teaching note: Simpson's Index ranges from 0 to 1. A value close to 1 indicates high diversity; a value close to 0 indicates low diversity. Here, the value of 0.22 is low because the earthworm population dominates the community.
(b) Advantage of Simpson's Index over species count [1]
- Answer: Simpson's Index takes into account both species richness (number of species) and species evenness (relative abundance of each species), whereas simply counting species only measures richness. [1]
- Marks: 1 for a valid advantage.
- Teaching note: A community with 5 species where one species dominates would have the same species count as a community with 5 equally abundant species, but the Simpson's Index would be lower for the dominated community.
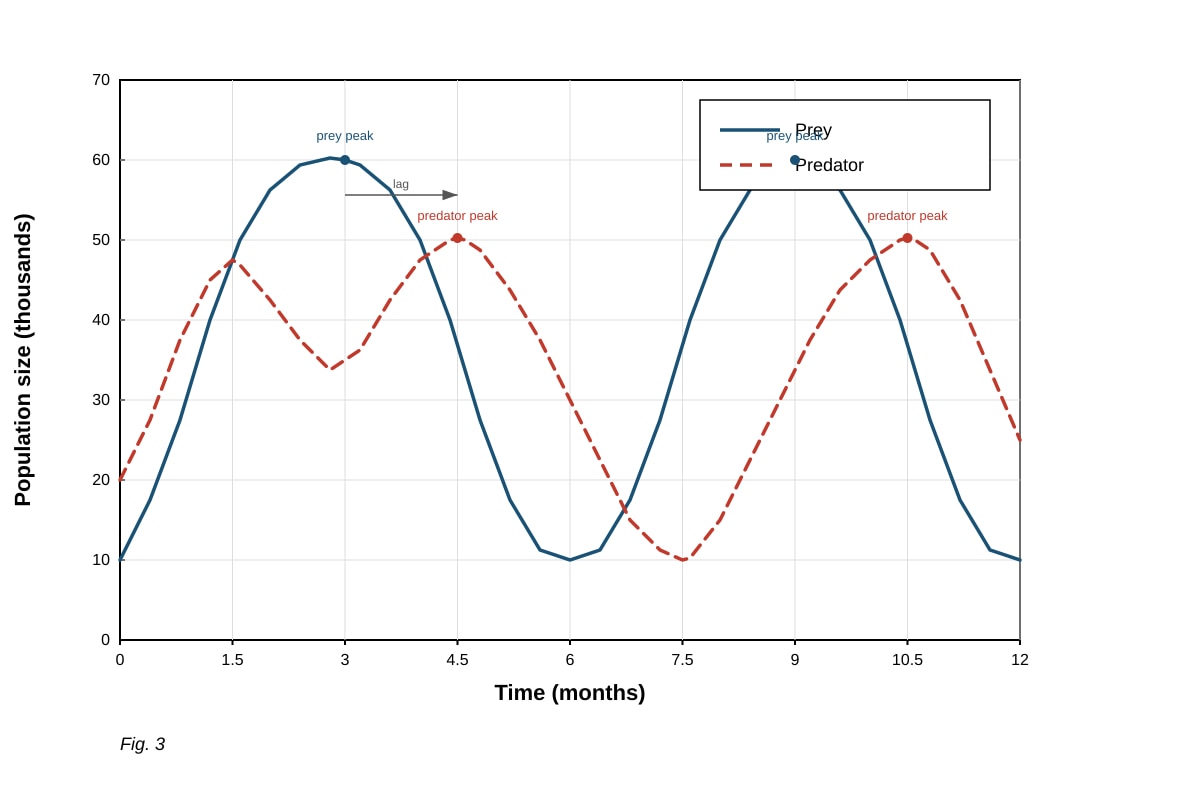
10. Predator-prey relationship
(a) Describe the relationship [2]
- Answer: The prey population peaks first, followed by a peak in the predator population shortly after. When the predator population increases, the prey population decreases. When the prey population is low, the predator population declines, allowing the prey population to recover. The two populations show cyclical oscillations with the predator peak lagging behind the prey peak. [2]
- Marks: 2 marks for a complete description including the lag and the cyclical pattern.
- Teaching note: This is a classic predator-prey cycle. The predator population depends on the prey for food, so changes in prey population drive changes in predator population with a time lag.
(b) Why predator population peaks after prey [1]
- Answer: The predator population increases in response to the increased food supply (prey). There is a time lag because predators need time to reproduce and increase their numbers after the prey population has increased. [1]
- Marks: 1 for a valid explanation.
- Teaching note: The predator population growth is limited by the availability of prey. When prey is abundant, predators have more food and can reproduce more successfully, but this response takes time.
Section C: Data-Based and Extended Response Questions (Questions 11–15)
11. Effect of nitrogen fertiliser on species richness
(a) Describe the effect [2]
- Answer: In Plot A (no fertiliser), species richness remained relatively constant at 12–13 species throughout the 5-year period. In Plot B (with fertiliser), species richness declined steadily from 12 species in Year 0 to 5 species in Year 5. [2]
- Marks: 1 mark for describing Plot A, 1 mark for describing Plot B.
- Teaching note: A good description should compare both plots and note the trend over time.
(b) Explain the observed effect [2]
- Answer: The addition of nitrogen fertiliser favours fast-growing, competitive species (often grasses) that can utilise the extra nitrogen effectively. These species outcompete slower-growing species for light and space, reducing species diversity. In the unfertilised plot, no species is favoured, allowing more species to coexist. [2]
- Marks: 2 marks for a valid explanation linking fertiliser to increased competition and reduced diversity.
- Teaching note: This is a well-documented ecological phenomenon. Nitrogen enrichment leads to eutrophication-like effects in terrestrial ecosystems, favouring a few competitive species at the expense of diversity.
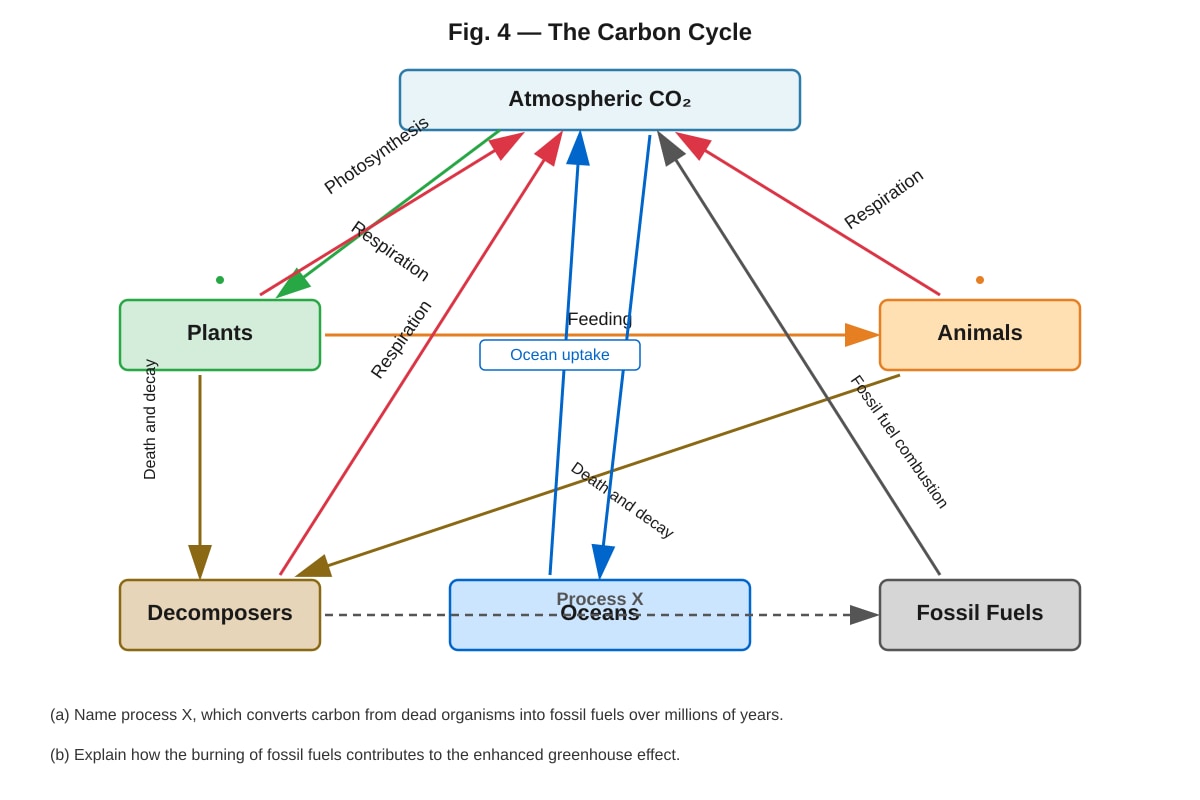
12. Carbon cycle
(a) Name process X [1]
- Answer: Fossilisation (or formation of fossil fuels)
- Marks: 1
- Teaching note: Over millions of years, dead organisms (particularly in anaerobic conditions) are compressed and transformed into fossil fuels (coal, oil, natural gas) through geological processes.
(b) Explain how burning fossil fuels contributes to the enhanced greenhouse effect [3]
- Answer:
- Burning fossil fuels releases carbon dioxide () into the atmosphere. [1]
- is a greenhouse gas that traps long-wave (infrared) radiation emitted from the Earth's surface, preventing heat from escaping into space. [1]
- The increased concentration of from fossil fuel combustion enhances the natural greenhouse effect, leading to global warming and climate change. [1]
- Marks: 3 marks for three valid points.
- Teaching note: The greenhouse effect is natural and necessary for life, but human activities (especially fossil fuel combustion) have increased greenhouse gas concentrations, enhancing the effect and causing global temperatures to rise.
13. Mark-release-recapture method
(a) Calculate estimated population size [2]
- Answer:
- Lincoln index:
- Where = number marked in first sample = 80
- = total caught in second sample = 100
- = number recaptured (marked) in second sample = 20
- Marks: 1 mark for correct formula and substitution, 1 mark for correct answer.
- Teaching note: The Lincoln index assumes that the proportion of marked individuals in the second sample reflects the proportion of marked individuals in the total population.
(b) Two assumptions of the method [2]
- Answer: Any two of:
- The population is closed (no immigration, emigration, birth, or death during the study period). [1]
- Marked individuals mix randomly with the unmarked population. [1]
- Marking does not affect the survival or behaviour of the individuals (marks are not lost or harmful). [1]
- The probability of capturing each individual is equal. [1]
- Marks: 2 marks for two valid assumptions.
- Teaching note: These assumptions are rarely all met in natural populations, so the estimate is approximate. For example, if marked individuals are more easily caught, the estimate will be biased.
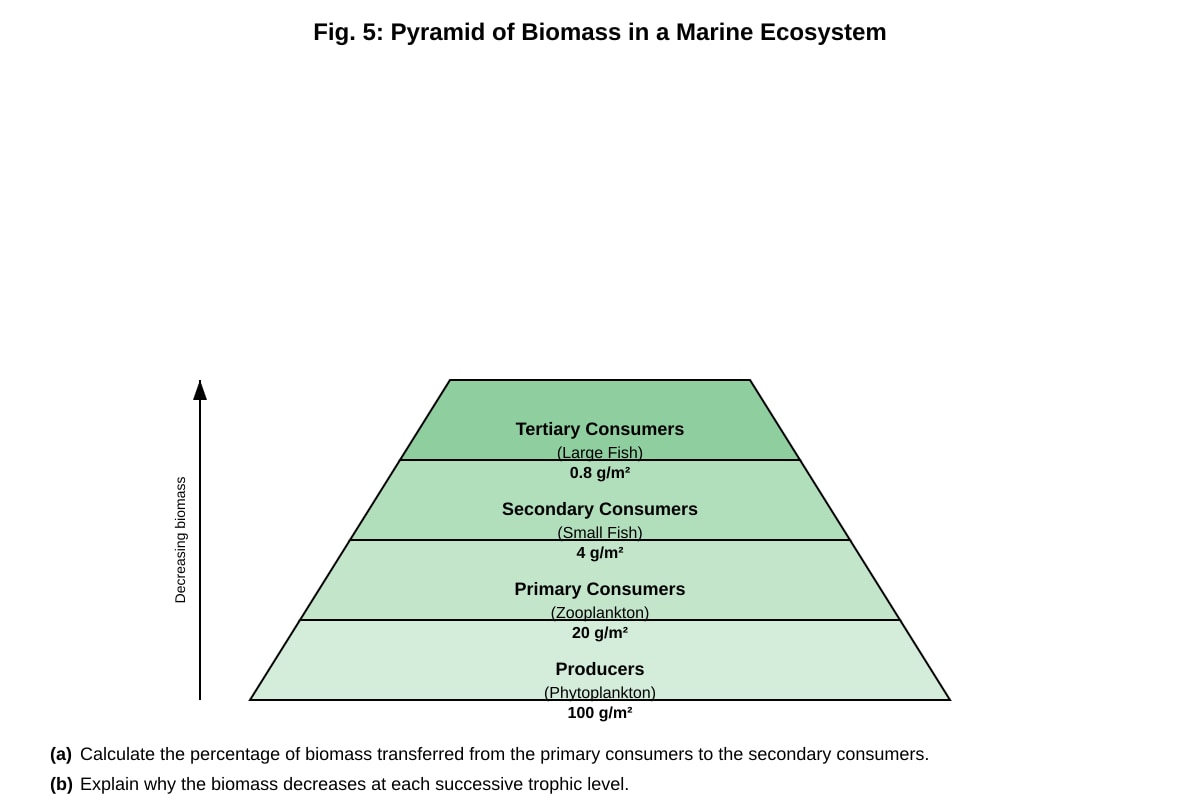
14. Biomass pyramid
(a) Percentage of biomass transferred [1]
- Answer:
- Marks: 1 for correct calculation and answer.
- Method: Biomass transfer efficiency = (biomass at higher trophic level ÷ biomass at lower trophic level) × 100.
(b) Why biomass decreases at each trophic level [2]
- Answer:
- Not all biomass of the lower trophic level is consumed by the next level (some is left uneaten, some is not digestible). [1]
- Some biomass is lost as heat through respiration and as waste products (excretion, egestion). [1]
- Marks: 2 marks for two valid reasons.
- Teaching note: The same principles apply as for energy transfer. Biomass represents the stored energy in organisms, so the same inefficiencies apply.
15. Effect of temperature on decomposition
(a) Describe the relationship [2]
- Answer: The rate of decomposition (mass loss) increases with temperature from 5°C to 25°C, reaching a maximum of 25% mass loss at 25°C. Above 25°C, the rate of decomposition decreases, with only 6% mass loss at 45°C. [2]
- Marks: 1 mark for describing the increase to 25°C, 1 mark for describing the decrease above 25°C.
- Teaching note: This is an example of an optimum curve. Decomposition is carried out by decomposers (bacteria and fungi), whose enzyme activity increases with temperature up to an optimum, then decreases as enzymes denature.
(b) Explain the pattern above 25°C [2]
- Answer: Above 25°C, the enzymes of the decomposer organisms (bacteria and fungi) begin to denature. Denaturation involves the breaking of bonds (hydrogen, ionic, disulfide) that maintain the enzyme's three-dimensional structure, causing the active site to change shape. This reduces enzyme activity and the rate of decomposition. [2]
- Marks: 2 marks for a valid explanation mentioning enzyme denaturation.
- Teaching note: Each decomposer species has an optimum temperature range. At temperatures above this range, enzyme activity decreases due to denaturation, and some decomposers may die.
Section D: Extended Response Questions (Questions 16–20)
16. Energy flow through an ecosystem [5]
- Answer:
- Energy enters the ecosystem from the sun as light energy. [1]
- Producers (autotrophs, e.g., plants) capture light energy through photosynthesis and convert it into chemical energy stored in organic molecules (glucose). [1]
- This chemical energy is transferred to primary consumers (herbivores) when they eat producers, and then to secondary and tertiary consumers through the food chain. [1]
- Energy transfer is inefficient because:
- Not all biomass is consumed (roots, bones, etc. are not eaten). [1]
- Energy is lost as heat through respiration, and in waste products (excretion and egestion). [1]
- Typically, only about 10% of energy is transferred between trophic levels.
- Marks: 5 marks distributed as: 1 for sun as source, 1 for photosynthesis, 1 for transfer through food chain, 2 for reasons for inefficiency.
- Teaching note: This question tests understanding of the fundamental concept of energy flow. Key points: energy enters as light, is fixed by photosynthesis, transferred through feeding, and lost through respiration, waste, and unconsumed biomass.
17. Roles of bacteria in the nitrogen cycle [5]
- Answer:
- (a) Nitrogen-fixing bacteria (e.g., Rhizobium in root nodules of legumes, Azotobacter in soil): Convert atmospheric nitrogen gas () into ammonia ()/ammonium ions (), making nitrogen available to plants. [2]
- (b) Nitrifying bacteria (e.g., Nitrosomonas, Nitrobacter): Convert ammonia/ammonium into nitrites () and then nitrates (). Nitrates are the main form of nitrogen absorbed by plants. [2]
- (c) Denitrifying bacteria (e.g., Pseudomonas): Convert nitrates in the soil back into atmospheric nitrogen gas (), removing nitrogen from the soil and returning it to the atmosphere. [1]
- Marks: 5 marks: 2 for nitrogen-fixing, 2 for nitrifying, 1 for denitrifying.
- Teaching note: The nitrogen cycle involves the conversion of nitrogen between different chemical forms. Key conversions:
- (nitrogen fixation)
- (nitrification)
- (denitrification)
- Organic N (ammonification by decomposers)
18. Ecological succession from bare rock to woodland [5]
- Answer:
- Pioneer species (e.g., lichens and mosses) colonise the bare rock. They are adapted to survive harsh conditions with little water and nutrients. [1]
- Lichens secrete acids that weather the rock, and their death and decay contribute organic matter, forming a thin layer of soil. [1]
- As soil develops, small plants (e.g., grasses and ferns) can establish. Their roots further break up the rock and add more organic matter when they die. [1]
- Over time, shrubs and then small trees colonise as the soil deepens and retains more water and nutrients. [1]
- Eventually, a climax community (mature woodland) develops, dominated by large trees. This community is stable and in equilibrium with the climate. [1]
- Marks: 5 marks for a logical sequence of stages.
- Teaching note: This is primary succession (starting from bare rock). Key concepts: pioneer species, soil formation, increasing species diversity and biomass, and the final climax community. Each stage modifies the environment, making it more suitable for the next stage.
19. Impact of climate change on species distribution and abundance [5]
- Answer:
- Distribution shifts: As temperatures rise, many species are shifting their ranges towards the poles (higher latitudes) and to higher altitudes (mountains) to track their optimal temperature conditions. [1]
- Abundance changes: Species adapted to warmer conditions may increase in abundance, while species adapted to cooler conditions may decline. [1]
- Phenological changes: Climate change alters the timing of biological events (e.g., flowering, migration, breeding), which can disrupt ecological relationships (e.g., predator-prey, plant-pollinator interactions). [1]
- Habitat loss: Rising sea levels and changing precipitation patterns can lead to loss of habitats (e.g., coastal wetlands, coral reefs), reducing species abundance. [1]
- Species extinction: Species unable to adapt or migrate fast enough may face extinction, reducing biodiversity. [1]
- Marks: 5 marks for five valid points.
- Teaching note: This question relates to the Extension Topic on Climate Change. Key impacts include: range shifts, abundance changes, phenological mismatches, habitat loss, and extinction risk. The question asks for "discussion," so multiple impacts should be covered.
20. Tropical rainforest vs temperate deciduous forest [5]
- Answer:
- Structure: Tropical rainforests have a more complex structure with multiple distinct layers (emergent layer, canopy, understorey, shrub layer, forest floor). Temperate deciduous forests have fewer, less distinct layers (canopy, understorey, forest floor). [1]
- Species diversity: Tropical rainforests have much higher species diversity than temperate deciduous forests. [1]
- Abiotic conditions: Tropical rainforests have high, relatively constant temperatures (25–28°C) and high rainfall throughout the year. Temperate deciduous forests have seasonal temperature variations (cold winters, warm summers) and moderate rainfall. [1]
- Adaptations: The constant warm, wet conditions in tropical rainforests allow year-round growth, supporting high productivity and diverse species. The seasonal conditions in temperate forests require trees to shed leaves in autumn/winter to reduce water loss and damage from frost. [1]
- Nutrient cycling: Tropical rainforests have rapid nutrient cycling due to warm, moist conditions favouring rapid decomposition. Temperate forests have slower decomposition, especially in winter, leading to a thicker leaf litter layer. [1]
- Marks: 5 marks for five valid points comparing structure and relating to abiotic conditions.
- Teaching note: This question requires comparison (both similarities and differences) and linking structure to abiotic factors. Key differences: complexity of layers, species diversity, seasonality, leaf adaptations, and nutrient cycling rates.
END OF ANSWER KEY