From Real Exams Quiz
A Level H1 Biology Ecology Quiz
Free A Level H1 Biology Ecology quiz, LongCat Exam version, with questions, answers, and A Level-style practice for Singapore students.
These static practice materials are generated from the site's syllabus and paper-generation workflow, with source and model context shown so students and parents can evaluate the material before use.
Questions
A-Level Biology H1 Quiz - Ecology
Name: ___________________________
Class: ___________________________
Date: ___________________________
Score: ________ / 50
Duration: 60 minutes
Total Marks: 50
Instructions:
- Answer ALL questions.
- Write your answers in the spaces provided.
- The number of marks for each question is shown in brackets [ ].
- You may use a calculator where appropriate.
- Where a question requires explanation or reasoning, answers must be written in clear, concise biological language.
Section A: Short Answer Questions (Questions 1–5)
Answer ALL questions. Each question is worth 2 marks unless otherwise stated.
1. Define the term population in the context of ecology.
[2]
2. Distinguish between a habitat and a niche.
[2]
3. State two abiotic factors that could limit the distribution of a plant species in a tropical rainforest.
(i) _________________________________________________________________________
(ii) ________________________________________________________________________
[2]
4. Explain what is meant by a food chain, and give one example with at least three organisms.
[2]
5. What is the role of decomposers in an ecosystem?
[2]
Section B: Short Answer and Structured Questions (Questions 6–10)
Answer ALL questions. Each question is worth 2 marks unless otherwise stated.
6. Define carrying capacity and explain why a population might fluctuate around this value.
[2]
7. Name the ecological relationship described in each scenario:
(a) A remora fish attaches to a shark, feeding on scraps of the shark's meals. The shark is unaffected.
_____________________________________________________________________________ [1]
(b) A tapeworm lives inside the intestine of a human, absorbing nutrients and causing malnutrition.
_____________________________________________________________________________ [1]
[2]
8. Explain why energy transfer between trophic levels is typically only about 10% efficient.
[2]
9. State two reasons why a pyramid of numbers may be inverted in some ecosystems.
(i) _________________________________________________________________________
(ii) ________________________________________________________________________
[2]
10. What is meant by primary succession? Give one example of a pioneer species.
[2]
Section C: Data-Response and Structured Questions (Questions 11–15)
Answer ALL questions.
11. Table 1 shows the population sizes of four species (A, B, C, D) in a grassland ecosystem over five years.
| Year | Species A | Species B | Species C | Species D |
|---|---|---|---|---|
| 2018 | 500 | 200 | 50 | 10 |
| 2019 | 480 | 210 | 55 | 12 |
| 2020 | 300 | 350 | 80 | 15 |
| 2021 | 150 | 400 | 120 | 20 |
| 2022 | 80 | 380 | 150 | 25 |
(a) Describe the trend shown by Species A and Species B over the five-year period.
[2]
(b) Suggest a possible ecological relationship between Species A and Species B, giving a reason for your answer.
[2]
(c) Calculate the percentage decrease in the population of Species A from 2018 to 2022. Show your working.
[2]
(d) Explain how the change in Species A's population might affect Species C and D.
[2]
[8]
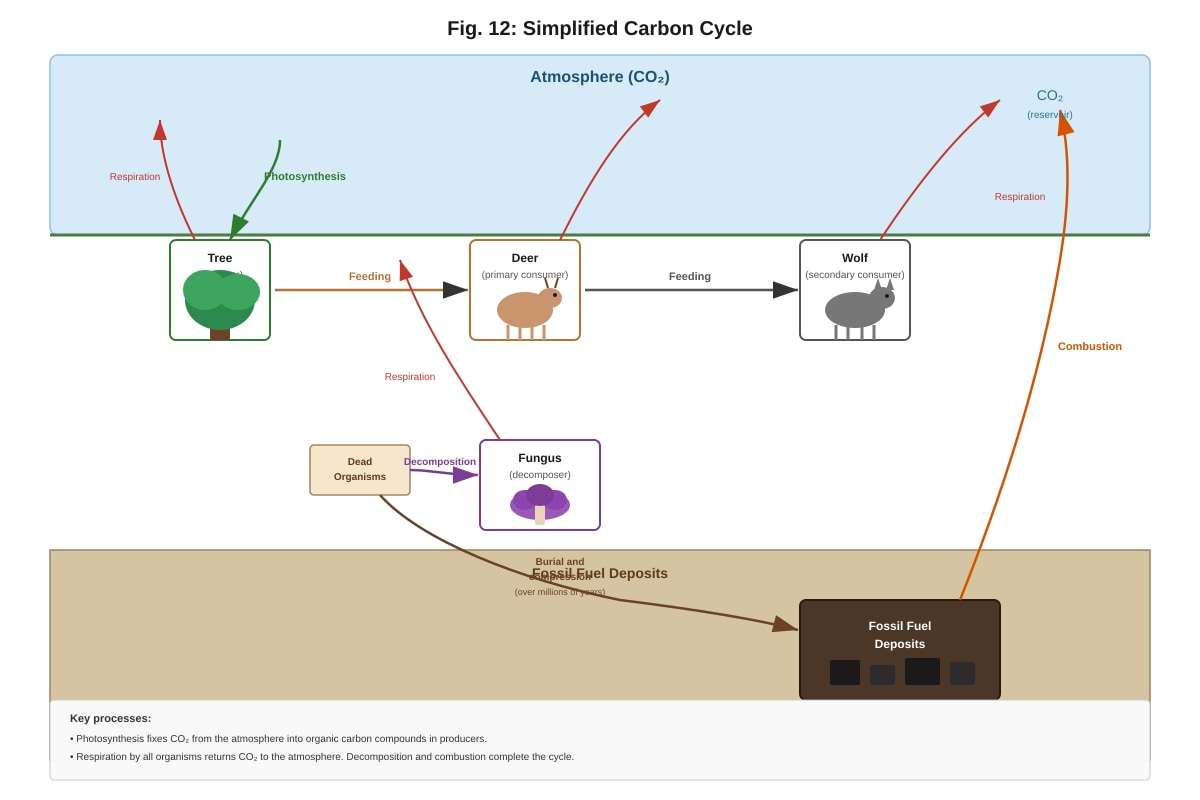
12. Fig. 12 shows a simplified carbon cycle.
Generated diagram for Q12.
(a) With reference to Fig. 12, name process X (CO₂ from atmosphere to tree) and process Y (CO₂ from organisms to atmosphere).
X: _________________________________________________________________________
Y: _________________________________________________________________________
[2]
(b) Explain how human activities have disrupted the carbon cycle, referring to Fig. 12.
[2]
(c) Describe the role of decomposers in the carbon cycle.
[2]
(d) Explain why the carbon cycle is considered a biogeochemical cycle.
[2]
[8]
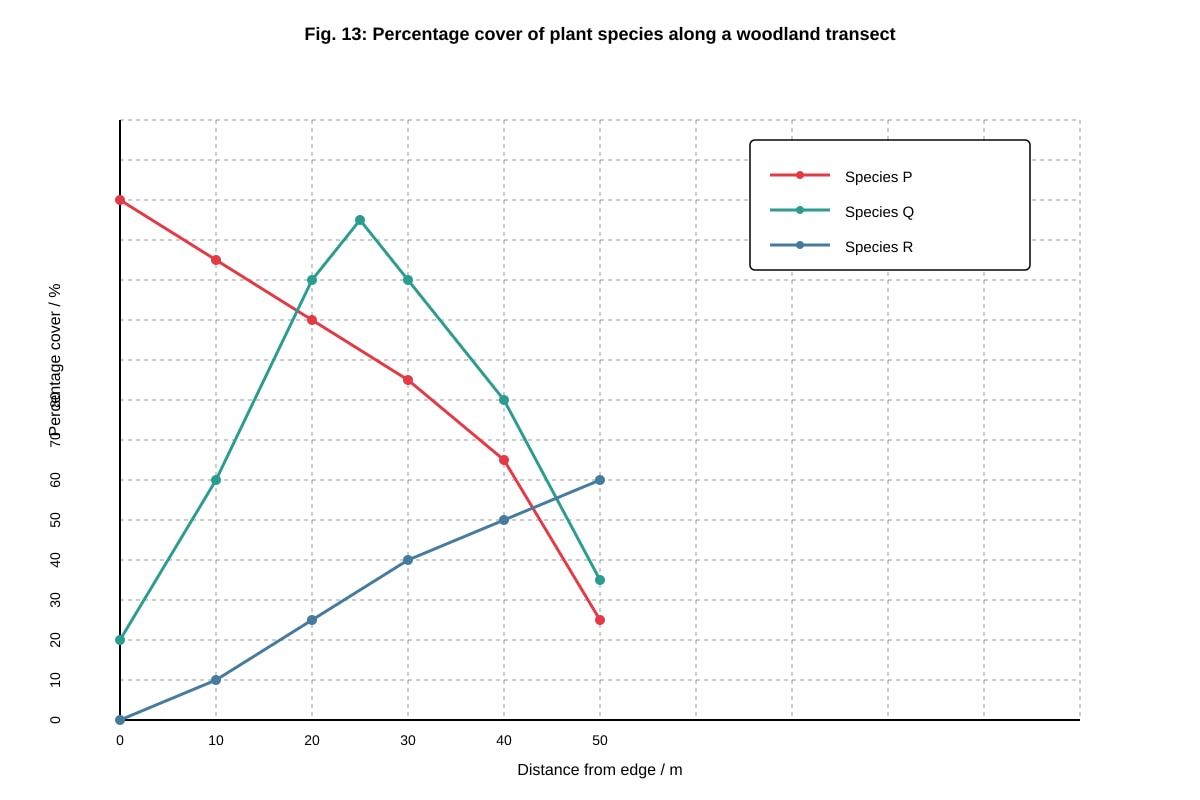
13. A student investigated the abundance of plant species along a transect from the edge to the centre of a woodland. The results are shown in Fig. 13.
Generated graph for Q13.
(a) With reference to Fig. 13, describe the change in percentage cover of Species R along the transect.
[2]
(b) Suggest one abiotic factor that could explain the distribution pattern of Species P.
[1]
(c) Explain why the student used a transect rather than random sampling in this investigation.
[2]
(d) Species Q shows a bell-shaped distribution. Explain what this suggests about the ecological tolerance of Species Q.
[2]
[7]
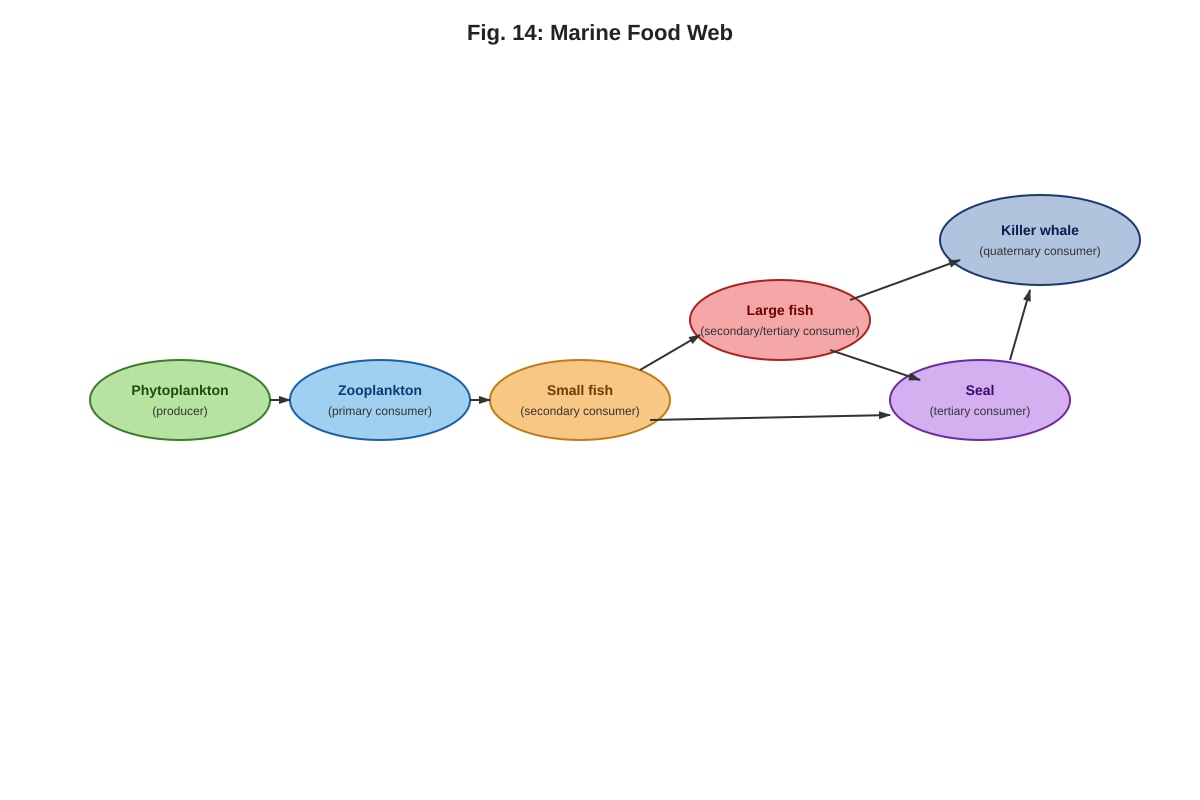
14. Fig. 14 shows a food web in a marine ecosystem.
Generated diagram for Q14.
(a) With reference to Fig. 14, state the trophic level of the seal.
[1]
(b) Name the producer in this food web.
[1]
(c) Explain what would happen to the population of killer whales if the large fish population decreased significantly.
[2]
(d) Explain why the killer whale has the least biomass of all organisms in this food web.
[2]
[6]
15. Describe the process of secondary succession in a disturbed ecosystem. In your answer, explain how the community changes over time and how it differs from primary succession.
[5]
Section D: Extended Response Questions (Questions 16–20)
Answer ALL questions.
16. Explain how the nitrogen cycle depends on the activities of different types of bacteria. In your answer, name each type of bacteria involved and describe its specific role.
[6]
17. A farmer clears a tropical rainforest to create agricultural land. Discuss the ecological consequences of this deforestation on:
(a) biodiversity
(b) the carbon cycle
(c) the water cycle
(d) soil fertility
[8]
18. Explain how intraspecific and interspecific competition can both act as factors that limit population growth. Give one example of each.
[5]
19. Describe how the process of conservation can be used to maintain biodiversity. In your answer, explain at least three different conservation strategies and why each is important.
[6]
20. A student carried out an investigation to compare the species diversity of two ponds using the Simpson's Diversity Index. The results are shown in Table 2.
| Pond X | Pond Y | |
|---|---|---|
| Number of species | 8 | 12 |
| Total number of organisms | 200 | 210 |
| Simpson's Diversity Index (D) | 0.72 | 0.85 |
(a) State which pond has the higher species diversity. Give a reason for your answer.
[1]
(b) Explain what the Simpson's Diversity Index measures and why it is a better measure of biodiversity than simply counting the number of species.
[2]
(c) Suggest two practical measures that could be taken to improve the species diversity of the pond with the lower diversity.
(i) _________________________________________________________________________
(ii) ________________________________________________________________________
[2]
[5]
END OF PAPER
Answers
A-Level Biology H1 Quiz - Ecology — Mark Scheme
Section A: Short Answer Questions (Questions 1–5)
1. Define the term population in the context of ecology. [2]
- A population is a group of organisms of the same species living in the same area at the same time.
2. Distinguish between a habitat and a niche. [2]
- A habitat is the place/environment where an organism lives.
- A niche is the role or position of an organism within its ecosystem, including all its interactions with biotic and abiotic factors (i.e., how it lives, what it feeds on, its activity patterns, etc.).
3. State two abiotic factors that could limit the distribution of a plant species in a tropical rainforest. [2]
- (i) Light intensity / availability
- (ii) Soil moisture / water availability / soil pH / temperature / mineral nutrients (any two valid abiotic factors)
4. Explain what is meant by a food chain, and give one example with at least three organisms. [2]
- A food chain shows the linear transfer of energy (or food/energy) from one organism to the next via feeding, starting with a producer.
- Example: Grass → Grasshopper → Frog → Snake (or any valid three-organism chain starting with a producer)
5. What is the role of decomposers in an ecosystem? [2]
- Decomposers (e.g., bacteria and fungi) break down dead organic matter (dead organisms and waste products).
- They recycle nutrients/elements (e.g., carbon, nitrogen) back into the soil/atmosphere, making them available for reuse by producers.
Section B: Short Answer and Structured Questions (Questions 6–10)
6. Define carrying capacity and explain why a population might fluctuate around this value. [2]
- Carrying capacity is the maximum population size that an environment can sustain/indefinitely support given the available resources (food, space, etc.).
- The population fluctuates because of changes in abiotic conditions, availability of resources, predation, disease, competition — when the population exceeds carrying capacity, resources become scarce and the population falls; when it is below, resources are abundant and the population can grow.
7. Name the ecological relationship described in each scenario: [2]
- (a) Commensalism — the remora benefits (food scraps) while the shark is unaffected.
- (b) Parasitism — the tapeworm benefits (nutrients) while the human is harmed (malnutrition).
8. Explain why energy transfer between trophic levels is typically only about 10% efficient. [2]
- Energy is lost as heat during respiration/metabolic processes at each trophic level.
- Not all organisms at one trophic level are consumed by the next; some energy remains in uneaten parts (bones, fur, cellulose) or is lost in faeces/urine (not assimilated).
- Energy used for movement, homeostasis, and life processes is not passed on.
9. State two reasons why a pyramid of numbers may be inverted in some ecosystems. [2]
- (i) A single large producer (e.g., one large tree) may support many primary consumers (e.g., insects), so the base is narrower than the level above.
- (ii) A large parasite may have many hyperparasites, or a food chain where one large organism supports many smaller organisms at the next trophic level.
10. What is meant by primary succession? Give one example of a pioneer species. [2]
- Primary succession is the colonisation and gradual development of a community in an area where no previous community existed and where there is no soil initially (e.g., bare rock, sand dune, volcanic island).
- Pioneer species example: Lichen / moss (any valid pioneer species).
Section C: Data-Response and Structured Questions (Questions 11–15)
11. [8]
(a) Describe the trend shown by Species A and Species B over the five-year period. [2]
- Species A shows a steady/continuous decrease in population from 500 in 2018 to 80 in 2022.
- Species B shows an overall increase in population from 200 in 2018 to a peak of 400 in 2021, then a slight decrease to 380 in 2022.
(b) Suggest a possible ecological relationship between Species A and Species B, giving a reason for your answer. [2]
- Predation (Species B preys on Species A) OR competition (Species B outcompetes Species A for resources).
- Reason: As Species A decreases, Species B increases, suggesting that Species B benefits from the decline of Species A (either by reduced competition or because Species B is a predator whose prey is declining — though if predation, the predator would eventually decline too, which is seen in 2022). Accept either with valid reasoning.
(c) Calculate the percentage decrease in the population of Species A from 2018 to 2022. Show your working. [2]
- Decrease = 500 − 80 = 420
- Percentage decrease = (420 / 500) × 100 = 84%
(d) Explain how the change in Species A's population might affect Species C and D. [2]
- Species C and D both increase over the same period.
- As Species A (possibly a dominant competitor or predator) decreases, Species C and D may benefit from reduced competition for resources (food, space) or reduced predation pressure, allowing their populations to grow.
12. [8]
(a) Name process X and process Y. [2]
- X: Photosynthesis
- Y: Respiration
(b) Explain how human activities have disrupted the carbon cycle, referring to Fig. 12. [2]
- Combustion of fossil fuels releases large amounts of CO₂ into the atmosphere, increasing atmospheric CO₂ levels beyond what the natural cycle can absorb.
- Deforestation reduces the number of producers (trees) available to absorb CO₂ via photosynthesis, reducing the rate of carbon fixation from the atmosphere.
(c) Describe the role of decomposers in the carbon cycle. [2]
- Decomposers (e.g., fungi, bacteria) break down dead organisms and organic waste.
- Through respiration, they release CO₂ back into the atmosphere, returning carbon to the abiotic environment so it can be reused by producers.
(d) Explain why the carbon cycle is considered a biogeochemical cycle. [2]
- Bio — it involves living organisms (producers, consumers, decomposers).
- Geo — it involves geological/abiotic components (atmosphere, fossil fuels, rocks).
- Chemical — it involves chemical transformations of carbon compounds (CO₂, glucose, carbonates, etc.).
- Carbon cycles between biological and geological/chemical reservoirs.
13. [7]
(a) Describe the change in percentage cover of Species R along the transect. [2]
- Species R shows a steady/gradual increase in percentage cover from 0% at the woodland edge to approximately 60% at the woodland centre (50 m).
(b) Suggest one abiotic factor that could explain the distribution pattern of Species P. [1]
- Light intensity — Species P is most abundant at the edge where light is most available and decreases towards the shaded centre. (Also accept: temperature, wind exposure, humidity.)
(c) Explain why the student used a transect rather than random sampling in this investigation. [2]
- A transect is used to study a gradual change/zonation in species distribution along an environmental gradient (e.g., from edge to centre, where light, humidity, and temperature change gradually).
- Random sampling would not capture this systematic change along a gradient; it would give an overall average without showing the pattern of change.
(d) Species Q shows a bell-shaped distribution. Explain what this suggests about the ecological tolerance of Species Q. [2]
- Species Q has an intermediate/optimal range of tolerance for the environmental conditions along the transect.
- It thrives best at intermediate conditions (around 25 m from the edge) where factors such as light, moisture, and temperature are at optimal levels.
- At both extremes (edge and centre), conditions are less suitable (too much light/exposure at the edge; too little light at the centre), so its abundance is lower.
14. [6]
(a) State the trophic level of the seal. [1]
- Tertiary consumer (or secondary consumer if it feeds only on small fish — accept tertiary consumer as it feeds on large fish which are secondary consumers).
(b) Name the producer in this food web. [1]
- Phytoplankton
(c) Explain what would happen to the population of killer whales if the large fish population decreased significantly. [2]
- The killer whale population would decrease because large fish are a food source for killer whales.
- With less food available, killer whales would face increased competition for the remaining food sources (e.g., seals), leading to reduced reproductive success and higher mortality, causing the population to decline.
(d) Explain why the killer whale has the least biomass of all organisms in this food web. [2]
- Energy is lost at each trophic level (approximately 90% is lost as heat through respiration, in faeces, and uneaten parts).
- Killer whales are at the highest trophic level, so only a small fraction of the energy originally captured by phytoplankton reaches them.
- Therefore, the biomass that can be supported at this level is the smallest.
15. Describe the process of secondary succession in a disturbed ecosystem. [5]
- Secondary succession occurs in an area where an existing community has been disturbed/removed but where soil remains (e.g., after a forest fire, abandoned farmland, or flood).
- It begins with pioneer species (e.g., grasses, weeds) that colonise the disturbed area because they are fast-growing, can tolerate harsh conditions, and have efficient seed dispersal.
- These pioneers modify the environment — they add organic matter to the soil as they die and decompose, improving soil fertility and moisture retention.
- This allows intermediate species (e.g., shrubs, small trees) to establish, which outcompete the pioneers for light and space.
- Over time, larger trees establish and form a canopy, shading out the intermediate species and creating a more complex community with greater biodiversity.
- Eventually, a climax community is reached — a relatively stable community that is in equilibrium with the local climate and conditions.
- Difference from primary succession: Secondary succession is faster because soil is already present (no need for soil formation from bare rock), and seeds, spores, and surviving root systems can regenerate more quickly. Primary succession starts from bare substrate with no soil and takes much longer.
Section D: Extended Response Questions (Questions 16–20)
16. Explain how the nitrogen cycle depends on the activities of different types of bacteria. [6]
- Nitrogen-fixing bacteria (e.g., Rhizobium in root nodules of legumes, Azotobacter in soil): Convert atmospheric nitrogen gas (N₂) into ammonia (NH₃) or ammonium ions (NH₄⁺) through nitrogen fixation. This makes atmospheric nitrogen available to living organisms, since plants cannot use N₂ directly.
- Nitrifying bacteria (e.g., Nitrosomonas and Nitrobacter): Convert ammonium compounds (NH₄⁺) into nitrites (NO₂⁻) and then into nitrates (NO₃⁻) through nitrification. Nitrates are the main form of nitrogen absorbed by plant roots.
- Denitrifying bacteria (e.g., Pseudomonas): Convert nitrates (NO₃⁻) back into nitrogen gas (N₂), which is released into the atmosphere. This completes the cycle but reduces the availability of fixed nitrogen in the soil.
- Decomposer bacteria (and fungi): Break down dead organic matter and animal waste, releasing ammonium compounds (NH₄⁺) back into the soil through ammonification/putrefaction. This returns nitrogen from organic compounds to the inorganic pool.
- Without these bacteria, nitrogen would remain locked in atmospheric N₂ or in dead organic matter, and the cycle would be incomplete — plants would not have access to usable nitrogen, and ecosystems would lack the nitrogen needed for protein and nucleic acid synthesis.
17. Discuss the ecological consequences of deforestation. [8]
(a) Biodiversity [2]
- Deforestation destroys habitats, leading to the loss of many plant and animal species that depend on the forest ecosystem.
- Species with small ranges or specialist niches are particularly vulnerable and may become endangered or extinct.
- Reduction in habitat size leads to smaller, fragmented populations that are more vulnerable to genetic drift, inbreeding, and local extinction.
- Overall species richness and genetic diversity decrease significantly.
(b) The carbon cycle [2]
- Trees absorb CO₂ through photosynthesis and store carbon in their biomass. Removing trees reduces the rate of CO₂ removal from the atmosphere.
- When trees are burned or left to decompose, the stored carbon is released back into the atmosphere as CO₂, increasing atmospheric CO₂ levels.
- This contributes to the enhanced greenhouse effect and global climate change.
(c) The water cycle [2]
- Trees play a key role in transpiration, returning water vapour to the atmosphere and promoting cloud formation and rainfall.
- Deforestation reduces transpiration, leading to reduced local rainfall and potentially causing drought.
- Without tree roots to absorb water and hold soil together, there is increased surface runoff, leading to flooding, soil erosion, and reduced groundwater recharge.
(d) Soil fertility [2]
- Tree roots hold soil in place; without them, topsoil is easily eroded by wind and rain, removing the nutrient-rich upper layer.
- The nutrient cycle is disrupted — normally, decomposers break down leaf litter and return nutrients to the soil. Without trees, there is less organic input.
- Exposed soil is subject to leaching, where rain washes away remaining nutrients (e.g., nitrates, minerals) from the soil into rivers and groundwater.
- Soil fertility declines rapidly, making it difficult for new plants to grow and reducing the land's productivity.
18. Explain how intraspecific and interspecific competition can both act as factors that limit population growth. [5]
-
Intraspecific competition occurs between individuals of the same species that share the same niche and require the same resources (food, water, space, mates).
-
As population density increases, resources become scarcer per individual, leading to reduced growth, reproduction, and survival.
-
This is a density-dependent factor — the effect intensifies as the population grows, eventually stabilising the population near the carrying capacity.
-
Example: Oak trees in a forest compete with each other for light, water, and soil nutrients. As the forest becomes denser, smaller trees are shaded out and die, limiting the population.
-
Interspecific competition occurs between individuals of different species that share overlapping niches and require similar resources.
-
The species that is better adapted to obtain the resources will outcompete the other, potentially leading to competitive exclusion or a reduction in the weaker competitor's population.
-
This limits the population growth of the inferior competitor and can determine species distribution.
-
Example: Grey squirrels and red squirrels compete for the same food (nuts, seeds) in UK woodlands. Grey squirrels are more efficient foragers and have outcompeted red squirrels, causing a significant decline in red squirrel populations.
-
Both types of competition act as density-dependent limiting factors that regulate population size and maintain ecological balance within ecosystems.
19. Describe how conservation can be used to maintain biodiversity. [6]
-
Establishing protected areas (e.g., national parks, nature reserves, marine protected areas):
- These areas are legally protected from development, logging, poaching, and other destructive activities.
- They provide safe habitats where species can live and reproduce without human interference.
- They help maintain ecosystem processes (e.g., nutrient cycling, pollination) and preserve genetic diversity.
- Example: The establishment of the Borneo Rainforest保护区 helps protect orangutans, pygmy elephants, and thousands of other species.
-
Captive breeding and reintroduction programmes:
- Endangered species are bred in controlled environments (zoos, breeding centres) to increase their population size.
- Offspring are reintroduced into the wild to boost wild populations or re-establish populations in areas where they have been lost.
- This helps prevent extinction and restores genetic diversity.
- Example: The captive breeding programme for the California condor helped increase the population from just 22 individuals to over 500.
-
Legislation and international agreements:
- Laws (e.g., the Endangered Species Act, CITES) protect threatened species from hunting, trade, and habitat destruction.
- International cooperation ensures that conservation efforts cross national boundaries, especially for migratory species.
- These legal frameworks provide enforcement mechanisms and penalties for violations.
-
Habitat restoration and rewilding:
- Damaged ecosystems (e.g., degraded wetlands, deforested land) are restored to their natural state through replanting, removal of invasive species, and re-establishment of natural processes.
- This increases the available habitat for native species and improves ecosystem function.
-
Education and community involvement:
- Raising awareness about the importance of biodiversity encourages sustainable practices and reduces human impact on ecosystems.
- Local communities can be involved in conservation efforts, providing economic incentives (e.g., ecotourism) that align human interests with conservation goals.
20. [5]
(a) State which pond has the higher species diversity. Give a reason for your answer. [1]
- Pond Y has the higher species diversity because it has a higher Simpson's Diversity Index value (0.85 compared to 0.72 for Pond X). A higher D value indicates greater diversity.
(b) Explain what the Simpson's Diversity Index measures and why it is a better measure of biodiversity than simply counting the number of species. [2]
- The Simpson's Diversity Index takes into account both species richness (the number of different species) and species evenness (how evenly individuals are distributed among those species).
- Simply counting the number of species (species richness) does not account for the relative abundance of each species. For example, a pond with 10 species but where 95% of individuals belong to just one species is less diverse than a pond with 10 species where each species has roughly equal numbers.
- The Simpson's Diversity Index gives a more complete and accurate picture of biodiversity because it reflects both the variety of species and how balanced the community is.
(c) Suggest two practical measures that could be taken to improve the species diversity of the pond with the lower diversity. [2]
- (i) Reduce pollution/nutrient input — limiting the use of fertilisers and pesticides in surrounding areas to prevent eutrophication, which favours a few dominant species over many others.
- (ii) Introduce a variety of native aquatic plants — this provides more habitats and food sources, supporting a wider range of invertebrate and fish species. (Also accept: create varied pond depths/margins, remove invasive species, reduce shading from overhanging trees, add shelter such as logs or rocks.)
END OF MARK SCHEME
Free quiz and exam paper access
Enter your details to view this paper
Your access is remembered on this device.