From Real Exams Quiz
A Level H1 Biology Ecology Quiz
Free A Level H1 Biology Ecology quiz, HY3 Exam version, with questions, answers, and A Level-style practice for Singapore students.
These static practice materials are generated from the site's syllabus and paper-generation workflow, with source and model context shown so students and parents can evaluate the material before use.
Questions
Free quiz and exam paper access
Enter your details to view this paper
Your access is remembered on this device.
Answers
A-Level Biology H1 Quiz - Ecology: Answer Key
Total Marks: 40
Topic: Ecology
Section A Answers (1–10)
1. [2 marks]
Definition: An ecosystem is a community of living organisms (biotic components) interacting with each other and with their non-living (abiotic) environment in a particular area.
Marking: 1 mark for community of organisms, 1 mark for interaction with abiotic environment.
Teaching note: Ecosystem includes both biotic (plants, animals, microbes) and abiotic (soil, water, climate) parts linked by energy flow and nutrient cycles.
2. [2 marks]
Abiotic: e.g., water temperature / dissolved oxygen / pH.
Biotic: e.g., predation by larger fish / competition for food / parasite.
Marking: 1 mark each, acceptable relevant example.
Common mistake: Giving two abiotic factors only.
3. [3 marks]
Energy is lost at each trophic level mainly as heat from respiration (1), not all parts of organisms are consumed (1), and not all consumed material is assimilated (1). Thus tertiary consumers receive less than primary consumers.
Teaching note: Only ~10% of energy transfers between levels (ecological efficiency).
4. [1 mark]
Nitrogen fixation.
Note: Specifically biological nitrogen fixation by prokaryotes (e.g., Rhizobium).
5. [2 marks]
Any two: high species diversity / resistant to small disturbances / nutrient cycling balanced / dominated by climax species adapted to climate.
Marking: 1 mark each.
6. [2 marks]
A population is a group of individuals of the same species in an area (1). A community is all populations of different species living and interacting in an area (1).
7. [2 marks]
Ratio = 1200 : 300 = 4 : 1.
Working: Divide both by 300 → 4 : 1.
Marking: 1 mark for correct simplification, 1 for format.
8. [1 mark]
Niche.
9. [2 marks]
Trees remove CO₂ via photosynthesis (1); cutting them reduces CO₂ uptake and burning/decomposition releases stored CO₂ (1).
10. [2 marks]
Gas: e.g., CO₂ / methane (CH₄).
Contribution: traps infrared radiation in atmosphere, enhancing greenhouse effect and warming Earth.
Marking: 1 mark each.
Section B Answers (11–15)
11. [3 marks]
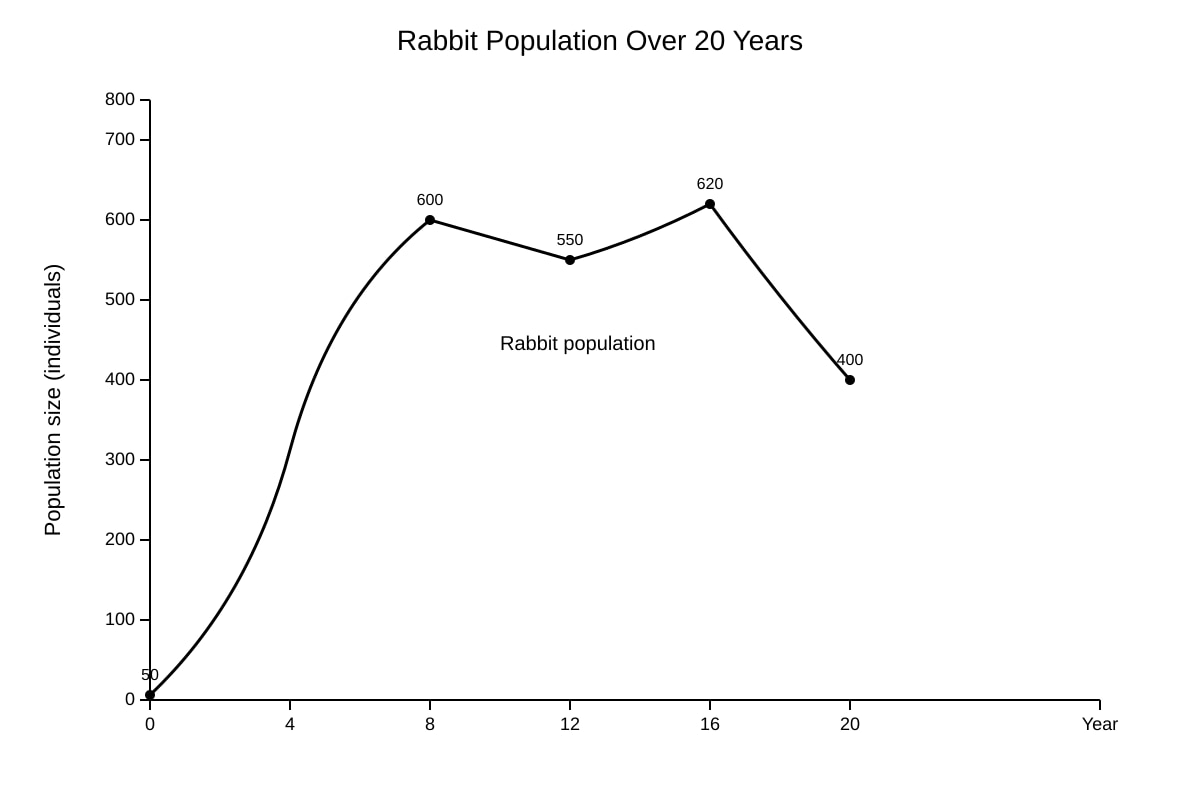
(a) [2] Population increased rapidly (exponentially) from 50 to 600 individuals between year 0 and 8, indicating a period of low limitation.
(b) [1] Predation increase / disease outbreak / food shortage.
Marking: (a) 1 for rise, 1 for magnitude/pattern; (b) 1 for valid biotic factor.
12. [2 marks]
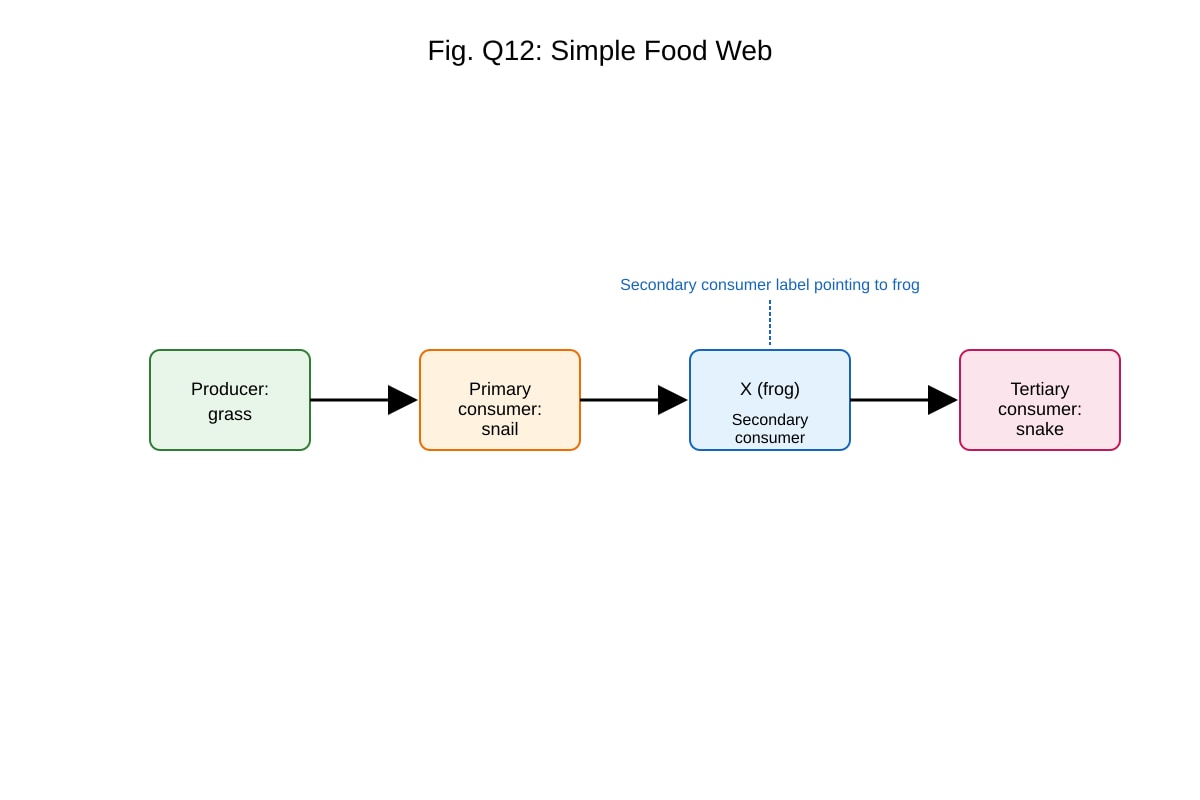
X is a secondary consumer (1) because it eats the primary consumer (snail) and is eaten by tertiary consumer (snake) (1).
Teaching note: Trophic level from position in food web.
13. [2 marks]
% decrease = ((9.2 – 4.1) / 9.2) × 100 = (5.1 / 9.2) × 100 = 55.4% ≈ 55%.
Marking: 1 for correct subtraction and division, 1 for answer.
14. [2 marks]
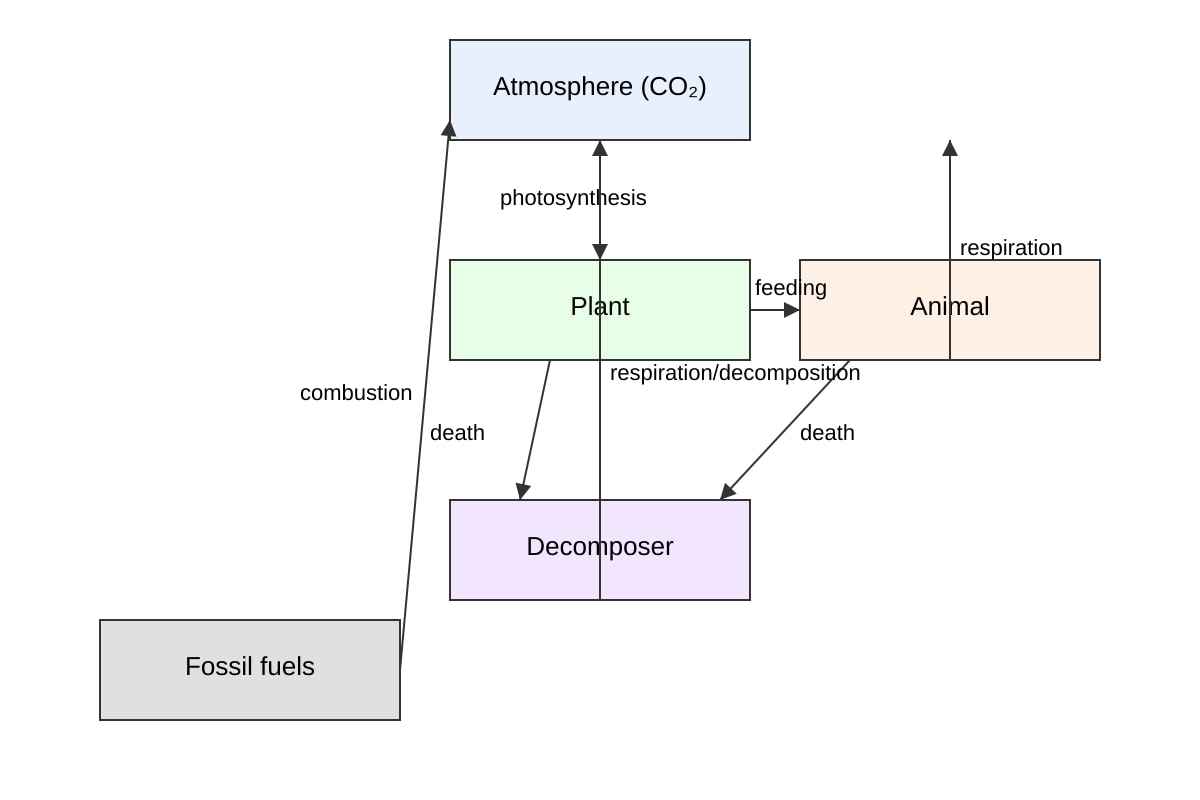
(i) Respiration (by animals/plants)
(ii) Decomposition (by decomposers)
Also accept: combustion of fossil fuels (but that is from geosphere, still to atmosphere).
Marking: 1 each.
15. [1 mark]
Total = 45 + 78 = 123 species.
Section C Answers (16–20)
16. [4 marks]
Climate warming raises temperatures and humidity suitable for Aedes aegypti survival (1), expands its geographic range into previously cooler areas (1), increases breeding cycle speed and bite rate (1), leading to greater transmission of dengue/zika (1). In Singapore, warmer urban areas and rainfall variability create more breeding sites.
Marking descriptors: 4 pts as above; 2–3 for partial mechanism; 1 for only stating spread.
17. [4 marks]
Sewage adds nutrients (N, P) causing eutrophication (1). Algal bloom grows, then dies (1). Decomposers respire using O₂, depleting dissolved oxygen (1). Fish and aerobic organisms die, reducing biodiversity (1).
Teaching note: Nutrient enrichment → hypoxia → death.
18. [3 marks]
Decomposers break down dead organic matter, releasing ammonia (ammonification) (1). Nitrifying bacteria convert ammonia to nitrite then nitrate (nitrification) (1), making nitrogen available to plants (1).
Marking: 1 each step.
19. [3 marks]
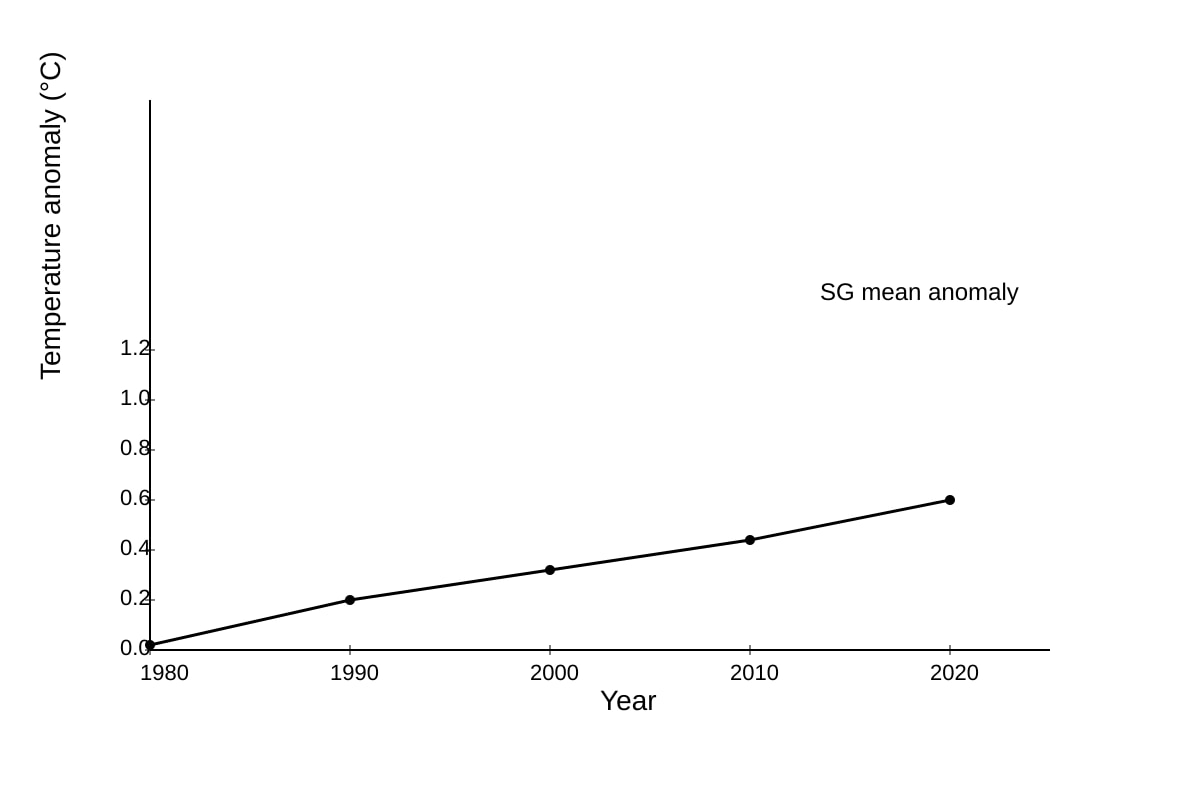
Trend: temperature anomaly rose from 0.1°C (1980) to 1.0°C (2020), ~1°C increase (1). This warming can shift species ranges, cause coral bleaching, mismatch breeding times (1), reducing local biodiversity (1).
Marking: 1 description, 2 impact.
20. [4 marks]
Biological control: targets specific pest, less pollution, sustainable (1) but slow, risk of predator becoming invasive (1). Chemical pesticide: fast knock-down (1) but kills non-targets, bioaccumulation, resistance (1). Evaluation should weigh ecology vs efficacy.
Marking: 2 points each side or balanced 4-point argument.