From Real Exams Quiz
A Level H1 Biology Ecology Quiz
Free A Level H1 Biology Ecology quiz, Exam version, with questions, answers, and A Level-style practice for Singapore students.
These static practice materials are generated from the site's syllabus and paper-generation workflow, with source and model context shown so students and parents can evaluate the material before use.
Questions
Free quiz and exam paper access
Enter your details to view this paper
Your access is remembered on this device.
Answers
A-Level Biology H1 Quiz - Ecology: Answer Key
Total Marks: 50
Section A: Multiple-Choice Questions (10 marks)
1. B) All the organisms of the same species living in a particular area at the same time [1]
Explanation: A population is defined as a group of individuals of the same species that live in the same area and can interbreed. Option A describes a community (all species in an area). Option C describes an ecosystem (community + abiotic factors). Option D describes a niche.
2. C) Secondary consumers [1]
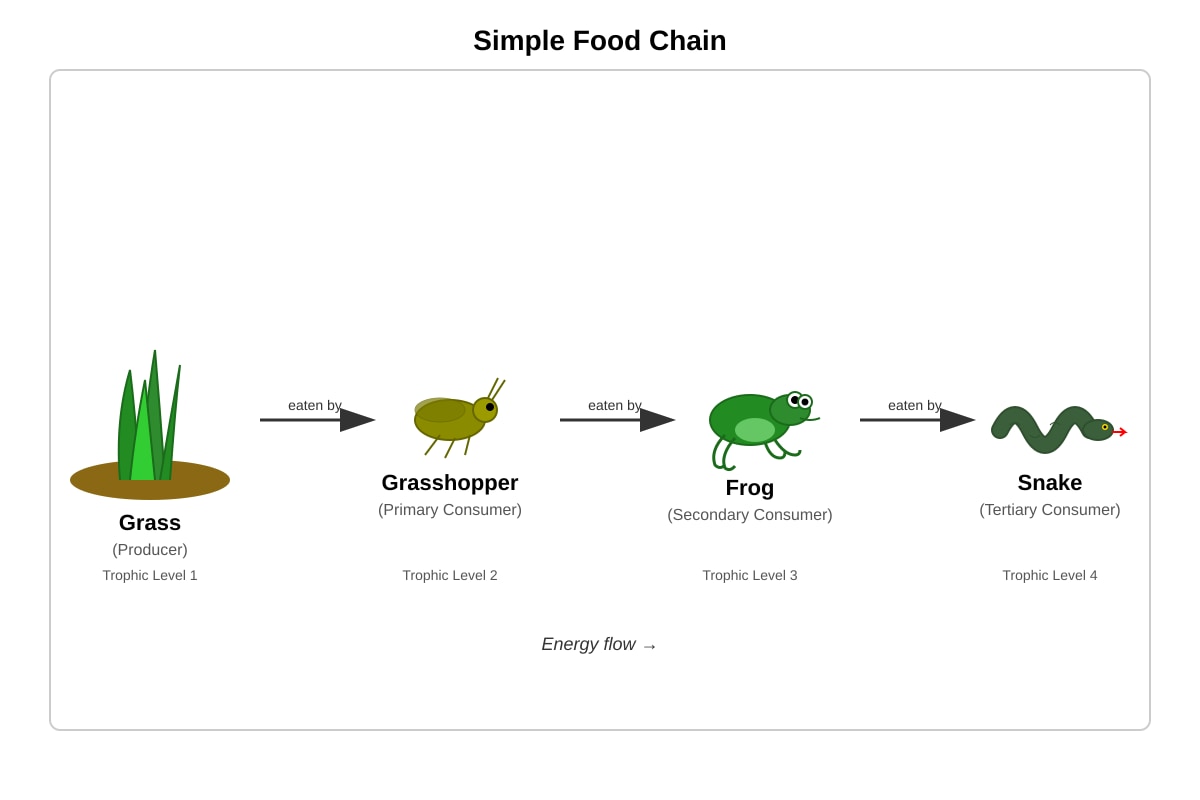
Explanation: In a food web, producers (plants) are the first trophic level. Primary consumers (herbivores) feed on producers. Secondary consumers feed on primary consumers. Tertiary consumers feed on secondary consumers.
3. C) 16% [1]
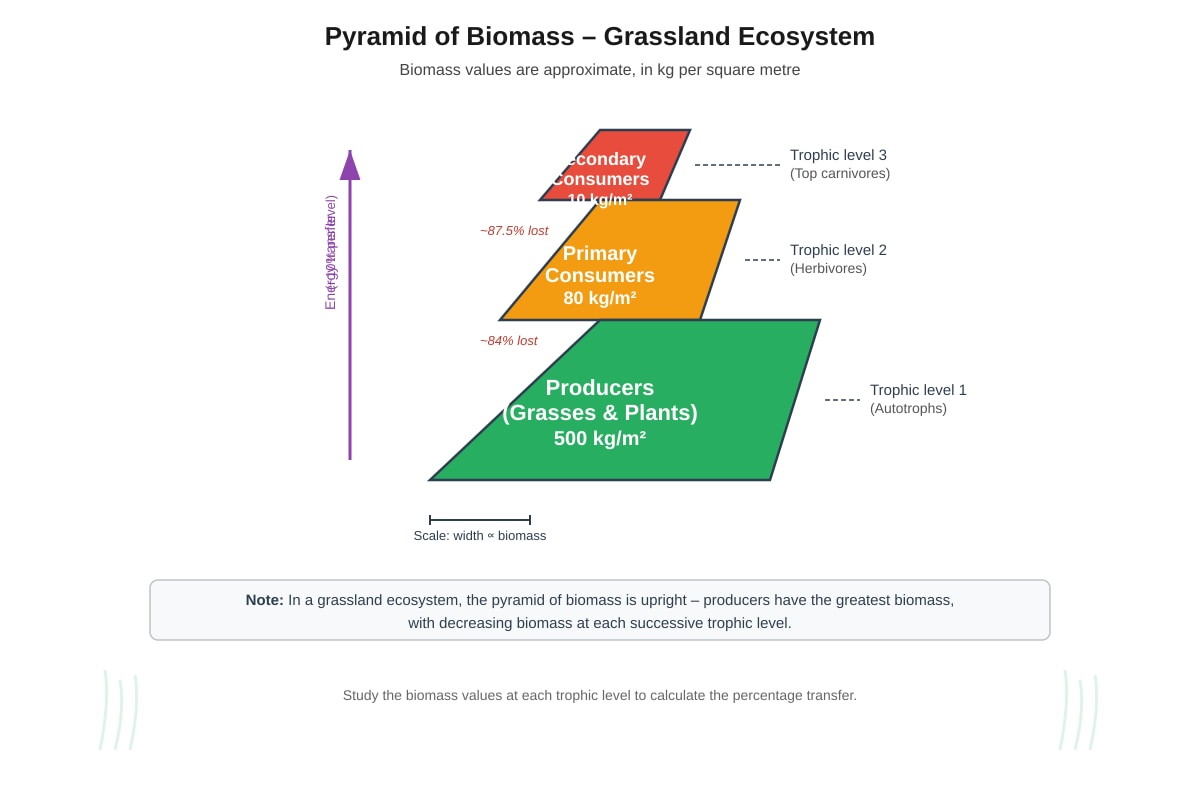
Explanation: The biomass transferred from producers (500 kg/m²) to primary consumers (80 kg/m²) is calculated as: (80 / 500) × 100% = 16%. This represents the ecological efficiency, which is typically around 10-20% due to energy losses at each trophic level.
4. D) Volcanic eruption [1]
Explanation: Density-independent factors affect populations regardless of their density. These include natural disasters (volcanic eruptions, earthquakes, floods), weather events, and human activities. Density-dependent factors (competition, predation, disease) have effects that vary with population density.
5. B) The maximum population size that an environment can sustain indefinitely [1]
Explanation: Carrying capacity (K) is the maximum population size that can be supported by the available resources in an environment over a long period. It is determined by limiting factors such as food, water, space, and other resources.
6. B) Nitrification [1]
Explanation: Nitrification is the two-step process carried out by nitrifying bacteria (e.g., Nitrosomonas and Nitrobacter). First, ammonium () is oxidised to nitrite (), then nitrite is oxidised to nitrate (). Nitrogen fixation converts atmospheric to ammonia. Denitrification converts nitrate back to atmospheric nitrogen. Ammonification converts organic nitrogen to ammonium.
7. C) Taking multiple random samples and calculating the mean [1]
Explanation: Random sampling reduces bias, and taking multiple samples increases the reliability of the estimate by accounting for variation in the distribution of clover. Using a larger quadrat can help but is less important than randomisation and replication. Placing the quadrat only where clover is visible would introduce bias.
8. B) A predator that controls the population of herbivores in its ecosystem [1]
Explanation: A keystone species has a disproportionately large effect on its ecosystem relative to its abundance. A predator that controls herbivore populations can prevent overgrazing and maintain plant diversity, thus having a cascading effect on the entire ecosystem.
9. D) Snake [1]
Explanation: This is an example of biomagnification. Non-biodegradable pesticides accumulate in the tissues of organisms and increase in concentration at each successive trophic level. The top predator (snake) accumulates the highest concentration of the pesticide.
10. B) The gradual change in the species composition of a community over time [1]
Explanation: Ecological succession is the process by which the structure and species composition of a community changes over time. It can be primary (starting from bare rock) or secondary (starting from existing soil after a disturbance).
Section B: Structured Questions (24 marks)
11. (a) Mean = (4 + 6 + 3 + 5 + 7 + 4 + 5 + 6 + 3 + 5) / 10 = 48 / 10 = 4.8 woodlice per quadrat [1]
(b) Total area = 2.0 m². Quadrat area = 0.25 m². Number of quadrats that fit in total area = 2.0 / 0.25 = 8. Estimated total population = mean per quadrat × number of quadrats = 4.8 × 8 = 38.4 ≈ 38 woodlice [2]
Marking notes: Award 1 mark for correct calculation of number of quadrats (8). Award 1 mark for correct final answer (38 or 38.4).
(c) Limitation: Woodlice are mobile and may move in or out of the quadrat during counting, leading to inaccurate counts. Improvement: Use a mark-release-recapture method instead, which is more suitable for mobile organisms. [2]
Alternative acceptable answers: Limitation: Quadrats may not capture the clumped distribution of woodlice under the log. Improvement: Use a systematic sampling method or increase the number of quadrats.
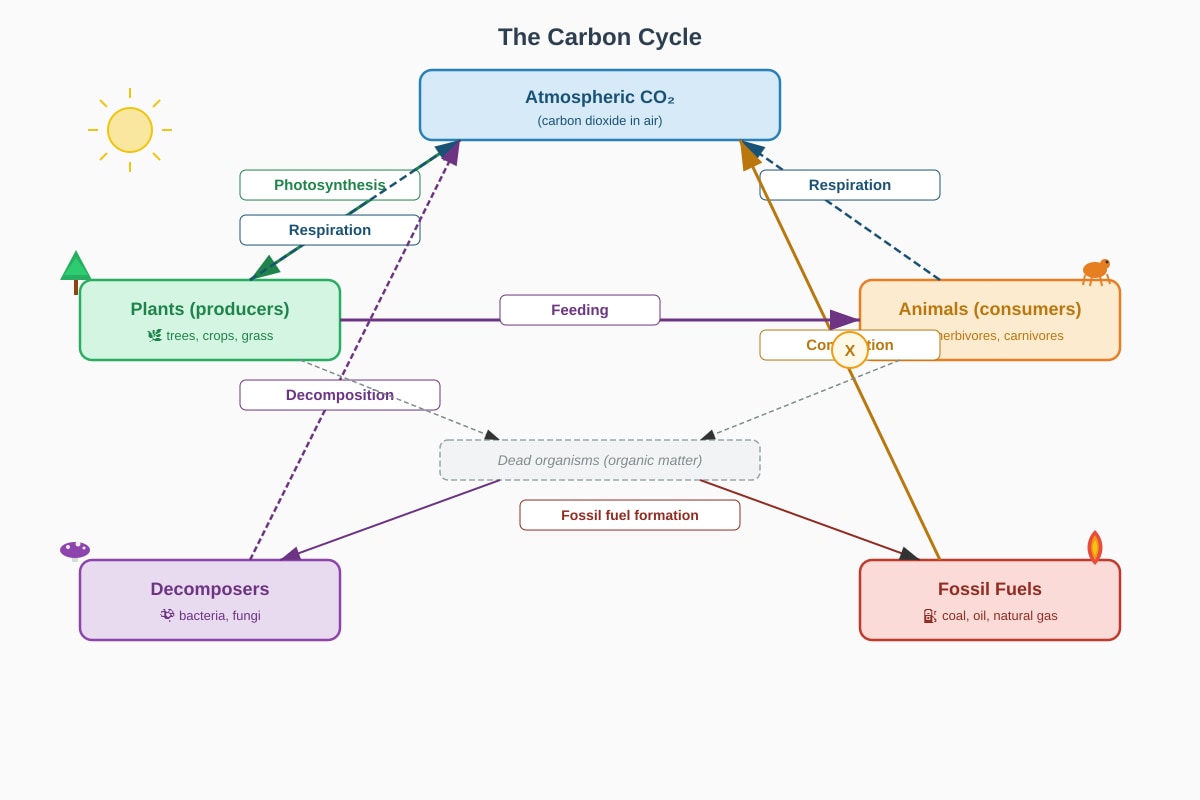
12. (a) Arrow X represents photosynthesis. [1]
(b) The burning of fossil fuels releases carbon dioxide that has been stored for millions of years into the atmosphere. This increases the concentration of atmospheric , contributing to the enhanced greenhouse effect and global warming. [2]
Marking notes: Award 1 mark for stating that burning releases stored carbon. Award 1 mark for explaining the effect on atmospheric concentration.
(c) Deforestation reduces the number of trees available to absorb through photosynthesis. Additionally, when trees are burned or decompose, they release the carbon stored in their tissues back into the atmosphere as . [2]
Marking notes: Award 1 mark for each valid point (reduced photosynthesis OR release of stored carbon).
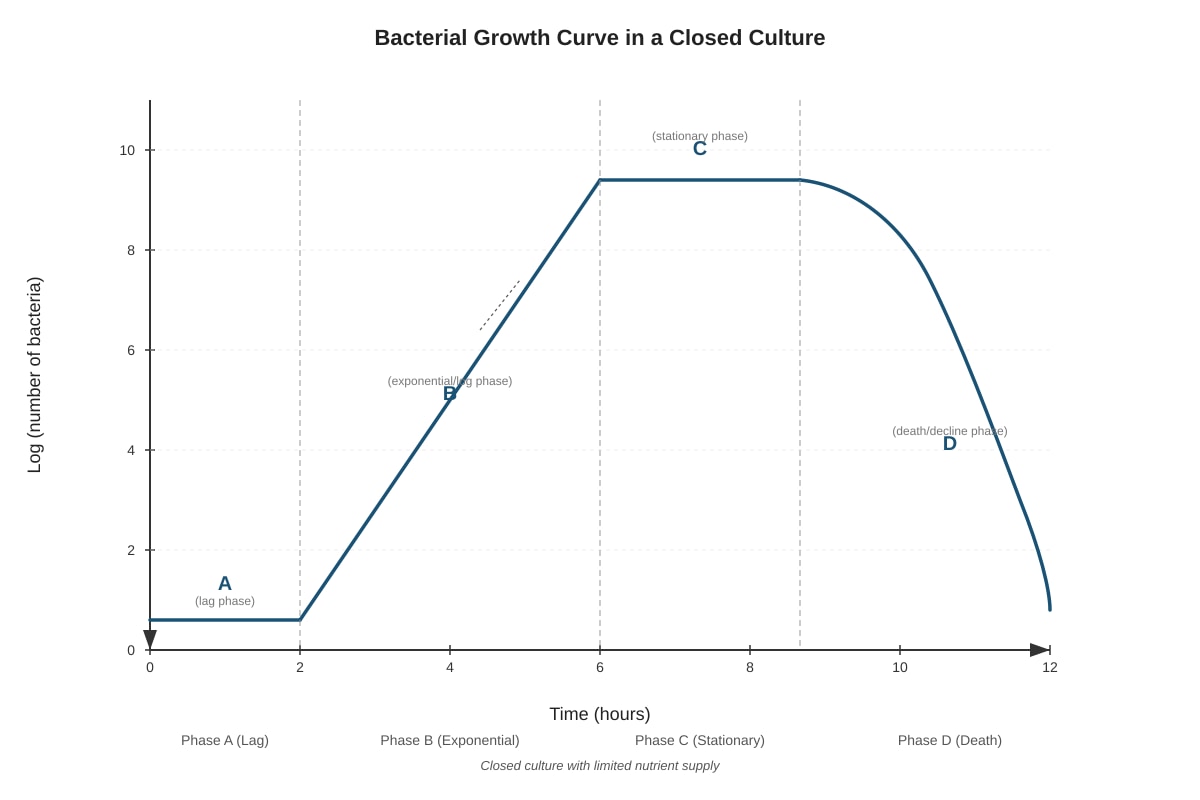
13. (a) Phase B is the exponential (log) phase. During this phase, the bacterial population is growing at its maximum rate. Nutrients are abundant, and waste products are minimal, so each bacterium divides at a constant rate, leading to exponential growth. [2]
Marking notes: Award 1 mark for correctly naming the phase. Award 1 mark for describing the rapid, unchecked growth.
(b) The population enters phase C (stationary phase) because the rate of cell division equals the rate of cell death. This occurs because nutrients become limiting, and waste products accumulate to toxic levels, slowing down growth. [2]
Marking notes: Award 1 mark for stating that growth rate equals death rate. Award 1 mark for explaining the limiting factors (nutrient depletion or waste accumulation).
(c) If fresh nutrients are added at the start of phase C, the population would likely resume exponential growth (enter a new phase B) as the limiting factor (nutrients) is no longer restricting growth. [1]
14. (a) Biomagnification (or bioaccumulation) [1]
(b) Concentration in producers = 0.04 ppm. Concentration in quaternary consumers = 10.24 ppm. Factor increase = 10.24 / 0.04 = 256 [2]
Marking notes: Award 1 mark for correct substitution. Award 1 mark for correct final answer.
(c) The osprey is at the highest trophic level and consumes many large fish over its lifetime. The toxic chemical is not easily broken down or excreted, so it accumulates in the tissues of each organism. As each organism consumes many prey items, the concentration increases at each trophic level. The osprey therefore accumulates the highest concentration, making it most susceptible to the toxic effects. [2]
Marking notes: Award 1 mark for explaining the accumulation process. Award 1 mark for linking the trophic level to the concentration effect.
15. (a) Any one of: mass of leaf litter, type of leaf litter, type of soil, moisture content of soil, pH of soil, duration of experiment, or initial mass of leaf litter. [1]
(b) As temperature increases from 5°C to 35°C, the rate of decomposition would increase. This is because the metabolic rate of decomposers (bacteria and fungi) increases with temperature (up to an optimum). Enzyme activity increases with temperature, leading to faster breakdown of organic matter. [2]
Marking notes: Award 1 mark for predicting an increase. Award 1 mark for explaining the effect on enzyme/metabolic activity.
(c) At temperatures above 45°C, the enzymes of the decomposers would denature (lose their three-dimensional structure), reducing their activity and thus decreasing the rate of decomposition. [1]
Section C: Data-Based Question (16 marks)
16. (a) An invasive species is an organism that is introduced, intentionally or accidentally, into an ecosystem where it is not native. [1]
(b) Number of cichlid species before introduction = 500. Number that went extinct = 200. Percentage = (200 / 500) × 100% = 40% [2]
Marking notes: Award 1 mark for correct substitution. Award 1 mark for correct final answer.
(c) The cichlids were particularly vulnerable because they had evolved in the absence of such a large predator and had no adaptations to avoid predation. They lacked defensive behaviours, morphological features (like spines), or other strategies to escape the Nile perch. [2]
Marking notes: Award 1 mark for stating lack of adaptations. Award 1 mark for elaboration.
(d) The decline of cichlids could disrupt the food web because cichlids occupied many ecological niches (algae grazers, detritus feeders, insectivores). Their loss could lead to an overgrowth of algae (if grazers are lost), accumulation of detritus, or an increase in insect populations, affecting other organisms that depend on these resources. [2]
Marking notes: Award 1 mark for identifying a specific disruption. Award 1 mark for explaining the consequence.
(e) Evaluation: The introduction boosted the fishing industry economically, providing food and income for local communities. However, it caused the extinction of approximately 200 cichlid species, drastically reducing biodiversity and disrupting the food web. The long-term ecological damage may outweigh the short-term economic benefits, as the loss of endemic species is irreversible and the ecosystem may become less stable and resilient. [3]
Marking notes: Award 1 mark for positive impact (economic benefit). Award 1 mark for negative impact (biodiversity loss). Award 1 mark for balanced evaluation or conclusion.
17. (a) Species X shows an increase in percentage cover from the riverbank (0% at 0 m) to a peak at 30 metres (70%), then a decrease at 35 and 40 metres. It is most abundant in the area between 25 and 35 metres from the riverbank. [2]
Marking notes: Award 1 mark for describing the general trend (increase then decrease). Award 1 mark for mentioning specific values or peak location.
(b) Species Y shows high cover near the riverbank and decreases with distance. This could be due to soil moisture (higher near the river) or light intensity (more shade in the forest). [1]
(c) At 15 metres, Species X = 30%, Species Y = 40%. Difference = 40% - 30% = 10% [1]
18. (a) A habitat is the physical place where an organism lives (e.g., a forest, a pond). A niche is the functional role of an organism in its ecosystem, including its interactions with biotic and abiotic factors (e.g., what it eats, when it is active, its reproductive strategy). [2]
Marking notes: Award 1 mark for each correct definition.
(b) The competitive exclusion principle states that two species cannot occupy the same niche indefinitely because they will compete for the same resources, and one will outcompete the other. This means that each species must have a unique niche to coexist, reducing direct competition. [2]
Marking notes: Award 1 mark for stating the principle. Award 1 mark for linking it to niche differentiation.
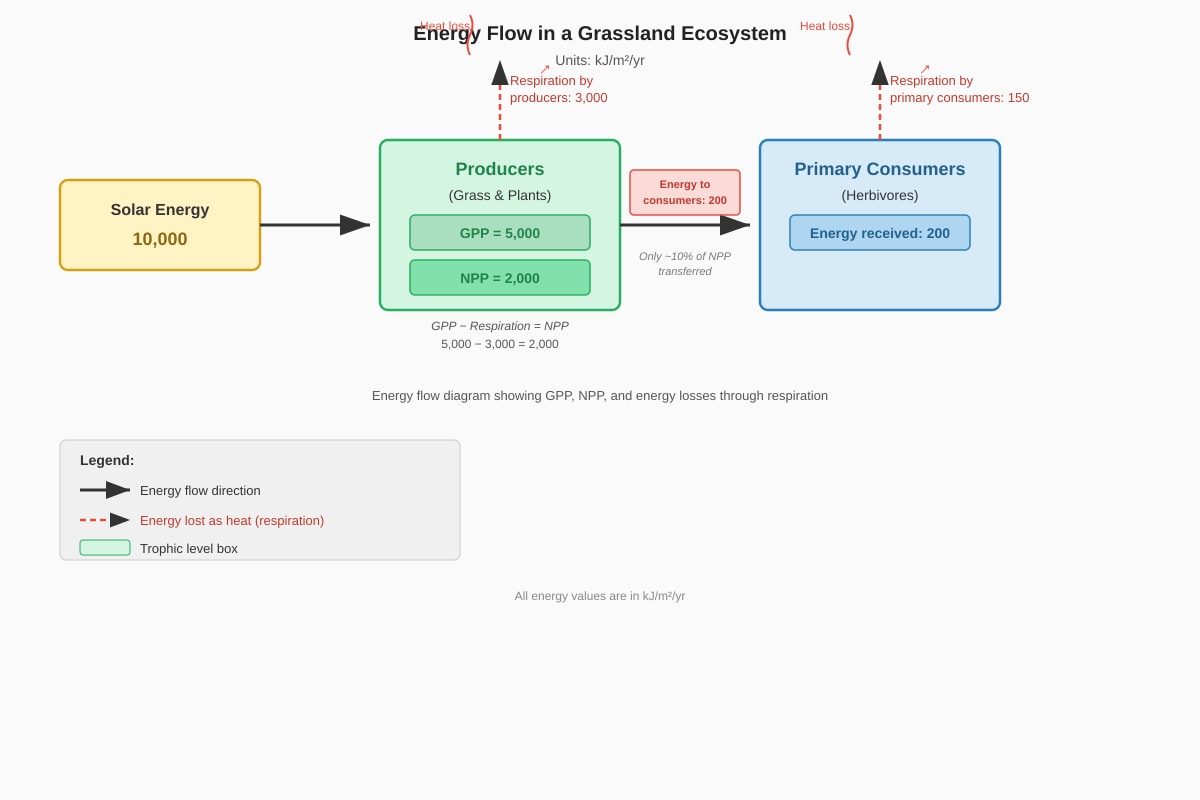
19. (a) Solar energy input = 10,000 kJ/m²/yr. GPP = 5,000 kJ/m²/yr. Percentage = (5,000 / 10,000) × 100% = 50% [2]
Marking notes: Award 1 mark for correct substitution. Award 1 mark for correct final answer.
(b) Only a small proportion of energy is transferred because much of the energy at each trophic level is lost as heat through respiration, used for growth and reproduction, or not consumed (e.g., parts of plants that are not eaten, such as roots and woody stems). Additionally, energy is lost in waste products and through incomplete digestion. [2]
Marking notes: Award 1 mark for mentioning respiration/heat loss. Award 1 mark for another valid reason (e.g., not all biomass is consumed, energy lost in waste).
20. (a) Independent variable: Distance from the lamp (or light intensity). Dependent variable: Number of oxygen bubbles produced per minute (or rate of photosynthesis). [2]
Marking notes: Award 1 mark for each correct variable.
(b) To ensure reliability, repeat the experiment multiple times at each distance and calculate the mean number of bubbles. [1]
Alternative acceptable answers: Use a data logger to count bubbles, control temperature, or use the same plant for all trials.
(c) Decreasing the distance between the lamp and the plant would increase the light intensity. This would increase the rate of oxygen bubble production (up to a point) because light is a limiting factor for photosynthesis. More light energy means more photons are available to excite electrons in chlorophyll, driving the light-dependent reactions faster. [2]
Marking notes: Award 1 mark for predicting an increase. Award 1 mark for explaining the effect of light intensity on photosynthesis.
End of Answer Key