From Real Exams Quiz
A Level H1 Biology Ecology Quiz
Free A Level H1 Biology Ecology quiz, Exam version, with questions, answers, and A Level-style practice for Singapore students.
These static practice materials are generated from the site's syllabus and paper-generation workflow, with source and model context shown so students and parents can evaluate the material before use.
Questions
Free quiz and exam paper access
Enter your details to view this paper
Your access is remembered on this device.
Answers
A-Level Biology H1 Quiz - Ecology: Answer Key
Total Marks: 40
Section A: Multiple Choice (10 marks)
1. B) They break down dead organic matter into inorganic nutrients. [2 marks]
- Explanation: Decomposers (e.g., bacteria and fungi) are essential in nutrient cycles. They secrete enzymes that break down dead organic matter (detritus) from plants and animals. This process releases inorganic nutrients (e.g., nitrates, phosphates) back into the soil or water, making them available for uptake by primary producers (plants). Option A describes photosynthesis (producers). Option C describes consumers. Option D describes nitrogen-fixing bacteria, a specific group of decomposers, but the general role of decomposers is broader.
- Common mistake: Students may confuse decomposers with nitrogen-fixing bacteria or primary consumers. Remember: decomposers recycle nutrients; they do not consume living organisms for energy in the same way as herbivores.
2. D) Primary producers [2 marks]
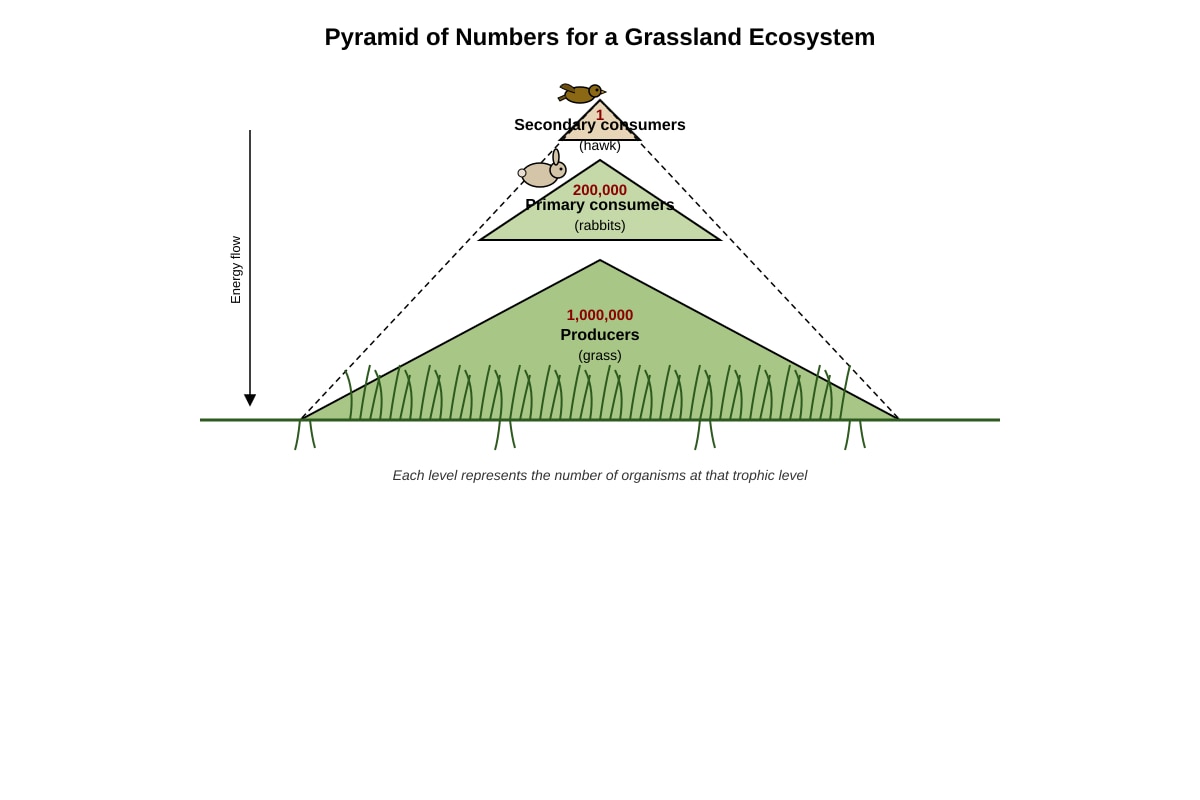
- Explanation: Biomass is the total mass of living organisms at a trophic level. Energy is lost at each trophic transfer (typically ~90% loss as heat, respiration, etc.). Therefore, the trophic level with the most energy (and thus the highest biomass) is always the primary producers (e.g., plants, algae). This is the foundation of the food web.
- Common mistake: Students may think primary consumers have the highest biomass because they are "first" consumers. Remember the 10% rule: only about 10% of energy is transferred to the next level, so biomass decreases up the food chain.
3. B) 10% [2 marks]
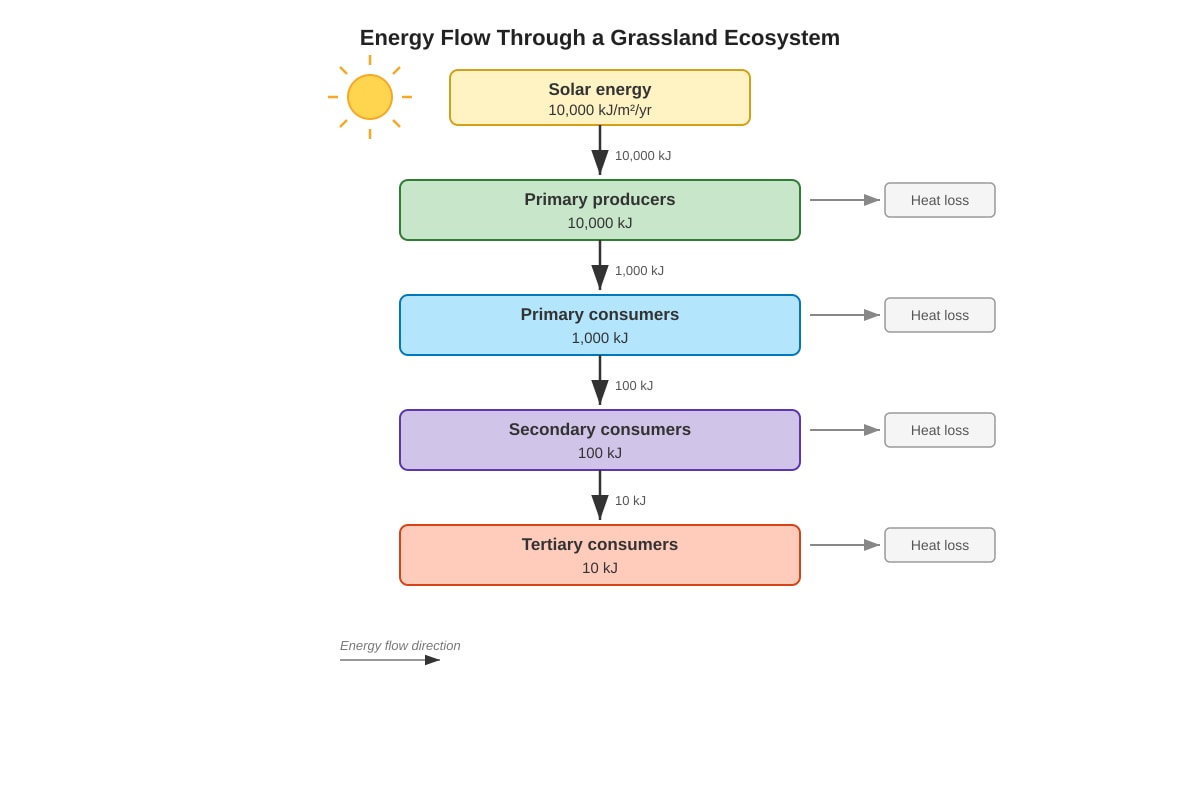
- Explanation: Energy transferred from primary consumers (1,000 kJ) to secondary consumers (100 kJ). Percentage transfer = (Energy at secondary consumers / Energy at primary consumers) × 100 = (100 / 1,000) × 100 = 10%. This is a classic example of the 10% energy transfer efficiency between trophic levels.
- Working: (100 kJ / 1,000 kJ) × 100% = 10%
- Common mistake: Students may calculate the percentage of the original solar energy (100/10,000 = 1%) instead of the transfer efficiency between the two specified trophic levels. Read the question carefully.
4. C) Competition for food [2 marks]
- Explanation: Density-dependent factors are those whose effects on a population change with population density. Competition for food becomes more intense as population size increases, leading to lower birth rates or higher death rates. Options A, B, and D are density-independent factors—they affect a population regardless of its size (e.g., a drought kills the same proportion of a small population as a large one).
- Common mistake: Students may confuse density-dependent and density-independent factors. Remember: density-dependent factors involve biotic interactions (competition, predation, disease) that intensify as the population grows.
5. B) Nitrification [2 marks]
- Explanation: The nitrogen cycle has several key steps:
- Nitrogen fixation: Atmospheric N₂ is converted to ammonia (NH₃) by bacteria.
- Nitrification: Ammonium ions (NH₄⁺) are converted to nitrite (NO₂⁻) and then to nitrate (NO₃⁻) by nitrifying bacteria (e.g., Nitrosomonas and Nitrobacter).
- Denitrification: Nitrates are converted back to N₂ gas by denitrifying bacteria.
- Ammonification: Organic nitrogen (from dead organisms) is converted to ammonium ions by decomposers.
- Common mistake: Students often confuse nitrification (NH₄⁺ → NO₃⁻) with nitrogen fixation (N₂ → NH₃). The key is that nitrification involves already fixed nitrogen (ammonium) being converted to a form (nitrate) that plants can readily absorb.
Section B: Structured Questions (20 marks)
6. (a) Estimated population size = 600 snails [2 marks]
- Working: Using the Lincoln-Petersen index: Population size (N) = (M × C) / R
- M = number marked in first sample = 120
- C = total caught in second sample = 150
- R = number recaptured (marked) in second sample = 30
- N = (120 × 150) / 30 = 18,000 / 30 = 600 snails
- Marking: 1 mark for correct formula and substitution; 1 mark for correct answer with unit.
- Common mistake: Students may invert the formula (e.g., (M × R)/C). Always check: the product of the two samples divided by the number of marked individuals in the second sample.
(b) Any two of the following assumptions: [2 marks, 1 mark each]
-
No immigration or emigration of snails between the two sampling days.
-
No births or deaths of snails between the two sampling days.
-
The marking does not affect the survival or behaviour of the snails (e.g., does not make them more visible to predators).
-
The marked snails mix completely and randomly with the unmarked population.
-
The probability of capturing a marked snail is the same as capturing an unmarked snail.
-
Explanation: The mark-release-recapture method relies on the proportion of marked individuals in the second sample reflecting the proportion of marked individuals in the whole population. Any violation of these assumptions will bias the estimate. For example, if marked snails are more likely to be eaten, R will be too low, and N will be overestimated.
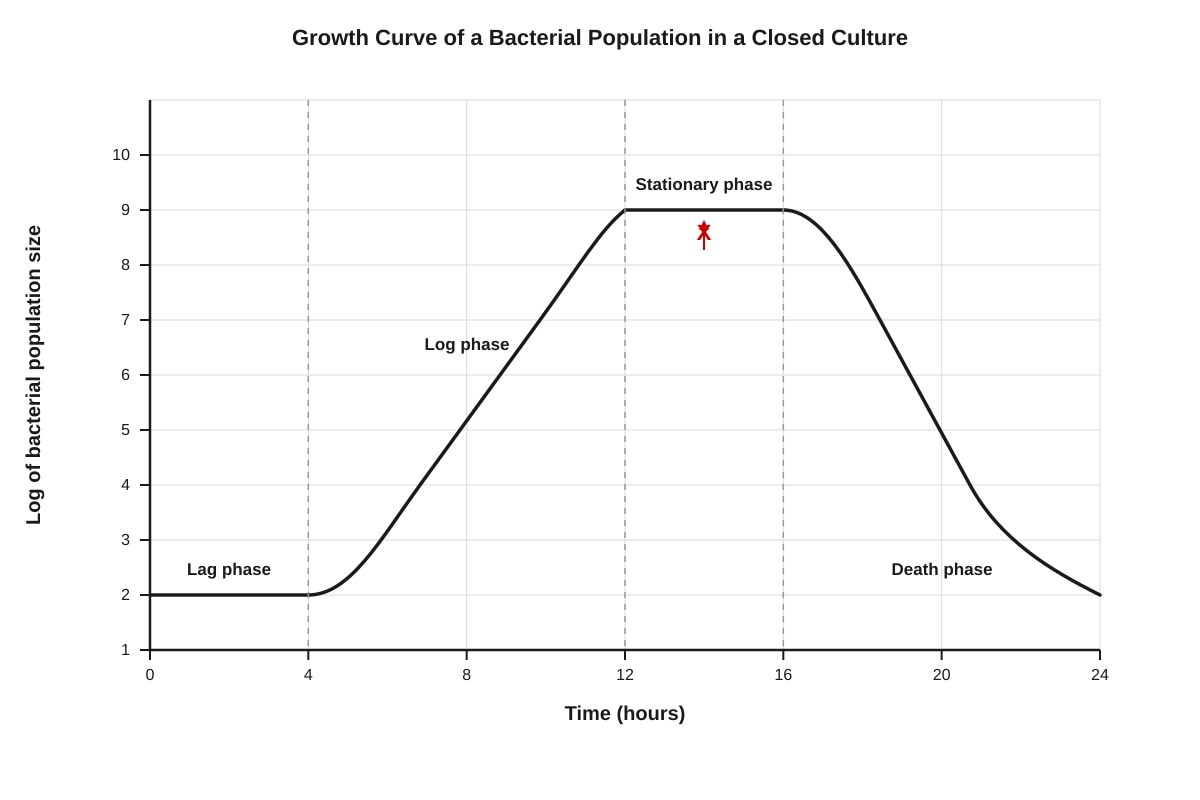
7. (a) Phase X is the lag phase. [1 mark]
- Explanation: The lag phase is the initial period of slow or no growth when bacteria are adapting to the new environment, synthesising necessary enzymes, and repairing any damage. Cell division has not yet begun at a rapid rate.
(b) During the stationary phase, the rate of cell division is equal to the rate of cell death. [3 marks]
- Explanation: The stationary phase occurs when the carrying capacity of the closed culture is reached. This is due to limiting factors:
- Nutrient depletion: Essential nutrients (e.g., glucose, amino acids) have been consumed, limiting further growth.
- Accumulation of toxic waste products: Metabolic by-products (e.g., organic acids, alcohols) build up and inhibit growth.
- Oxygen depletion: In an aerobic culture, oxygen may become limiting.
- Space limitation: Physical space may become a constraint.
- Because the birth rate equals the death rate, the overall population size remains constant (a plateau on the graph).
- Marking: 1 mark for stating birth rate = death rate; 1 mark for explaining nutrient depletion; 1 mark for explaining waste accumulation or another valid limiting factor.
8. (a) As depth increases, the concentration of dissolved oxygen decreases. [2 marks]
- Explanation: The data shows a clear negative correlation: at 0 m (surface), DO is 9.2 mg/L; at 20 m, DO is 1.8 mg/L. The decrease is not linear—there is a sharper drop between 10 m and 15 m.
- Marking: 1 mark for stating the negative relationship (as depth increases, DO decreases); 1 mark for providing specific data points to support the description (e.g., "from 9.2 mg/L at the surface to 1.8 mg/L at 20 m").
(b) Low dissolved oxygen at 20 m is due to limited photosynthesis and high rates of decomposition. [2 marks]
- Explanation: At greater depths, light penetration is insufficient for photosynthesis by aquatic plants and algae. Therefore, oxygen is not being produced. Additionally, dead organic matter (detritus) sinks to the bottom, where decomposers (aerobic bacteria) break it down, consuming oxygen in the process (biological oxygen demand, BOD). The combination of no oxygen production and high oxygen consumption leads to low DO levels.
- Marking: 1 mark for explaining lack of photosynthesis; 1 mark for explaining decomposition/respiration consuming oxygen.
- Common mistake: Students may only state "no light" without linking it to photosynthesis and oxygen production.
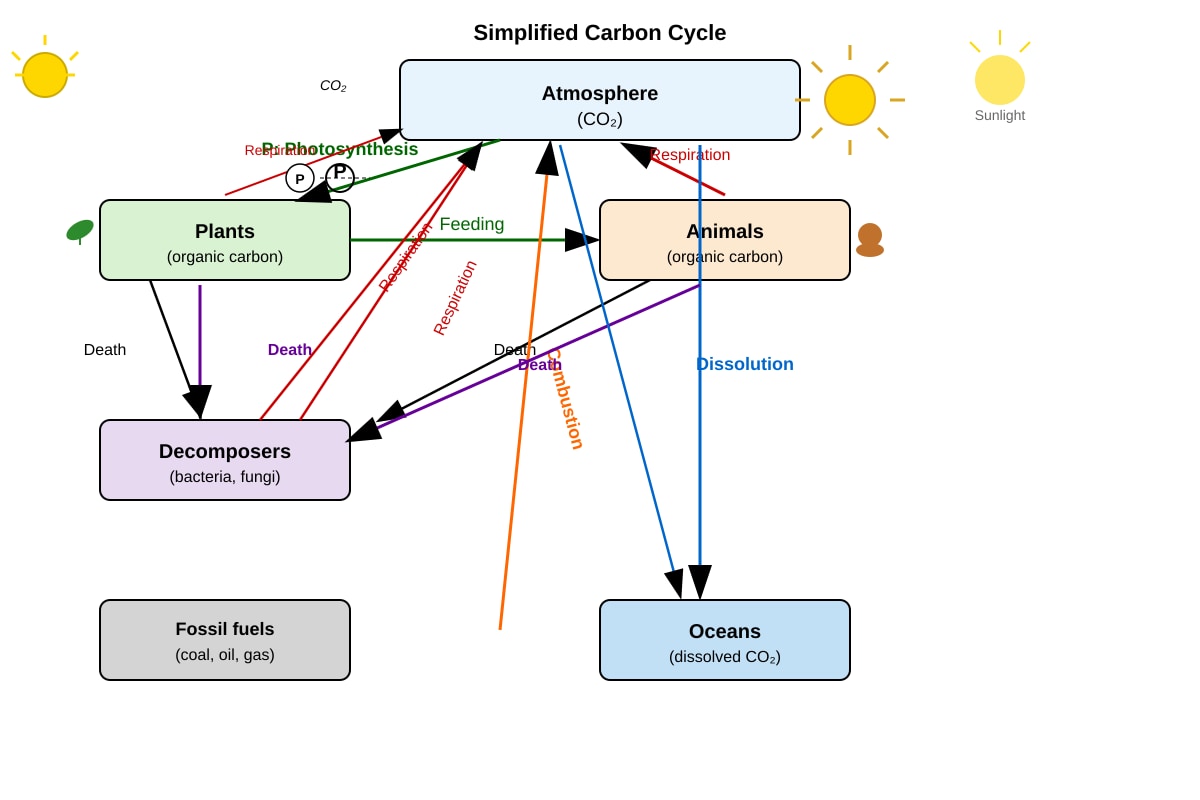
9. (a) Arrow P represents respiration. [1 mark]
- Explanation: The arrow points from Animals to the Atmosphere (CO₂). Animals obtain organic carbon by feeding on plants. Through cellular respiration, they break down organic molecules to release energy, producing CO₂ as a by-product, which is released into the atmosphere.
(b) Burning fossil fuels releases stored carbon (from ancient organic matter) as CO₂ into the atmosphere. [3 marks]
- Explanation: Fossil fuels (coal, oil, natural gas) are formed from the remains of ancient organisms that have been compressed and heated over millions of years. This carbon was effectively removed from
<stage3_quiz_answers_md>
A-Level Biology H1 Quiz - Ecology - ANSWERS
Total Marks: 40
Section A: Multiple Choice (10 marks)
1. Which of the following best describes the role of decomposers in a nutrient cycle? B) They break down dead organic matter into inorganic nutrients.
[2 marks]
2. In a food web, which trophic level typically has the highest biomass? D) Primary producers
[2 marks]
3. What is the approximate percentage of energy transferred from primary consumers to secondary consumers? B) 10%
[2 marks]
4. Which of the following is a density-dependent factor that can regulate population size? C) Competition for food
[2 marks]
5. In the nitrogen cycle, which process converts ammonium ions () into nitrate ions ()? B) Nitrification
[2 marks]
Section B: Structured Questions (20 marks)
6. (a) Estimated population size = (Number marked in first sample × Total number in second sample) / Number of marked individuals in second sample = (120 × 150) / 30 = 600 snails
[2 marks]
(b) Two assumptions:
- The marked snails have mixed evenly with the unmarked population.
- No births, deaths, immigration, or emigration occurred between the two sampling occasions.
- The marking does not affect the survival or behaviour of the snails.
- The probability of capturing a marked snail is the same as capturing an unmarked snail. (Any two valid assumptions)
[2 marks]
7. (a) Phase X is the log phase (or exponential phase).
[1 mark]
(b) During the stationary phase, the rate of bacterial cell division equals the rate of cell death. This occurs because essential nutrients become limiting, and waste products accumulate to toxic levels, preventing further net growth. The population size remains relatively constant as the number of new cells produced is balanced by the number of cells dying.
[3 marks]
8. (a) As depth increases, the dissolved oxygen concentration decreases. The relationship is negative; the highest concentration is at the surface (9.2 mg/L at 0 m) and the lowest is at 20 m (1.8 mg/L).
[2 marks]
(b) At 20 m depth, there is little to no light penetration, so photosynthesis by aquatic plants and algae cannot occur. Therefore, oxygen is not produced. Additionally, respiration by organisms and decomposition of organic matter sinking from the surface consumes oxygen, leading to low levels.
[2 marks]
9. (a) Arrow P represents photosynthesis.
[1 mark]
(b) Burning fossil fuels releases large amounts of carbon dioxide (CO₂) that has been stored underground for millions of years into the atmosphere. This increases the concentration of CO₂, a greenhouse gas, in the atmosphere. The enhanced greenhouse effect traps more heat, leading to a rise in global average temperatures (global warming), which alters climate patterns and contributes to climate change.
[3 marks]
10. (a) As temperature increases from 5°C to 35°C, the rate of CO₂ production increases, indicating a higher rate of respiration. The rate peaks at 35°C (4.1 mg/g/h). However, at 45°C, the rate drops sharply to 1.5 mg/g/h.
[2 marks]
(b) At 45°C, the enzymes involved in respiration (e.g., those in the Krebs cycle and electron transport chain) begin to denature. Denaturation alters the active site of the enzymes, reducing their ability to catalyse reactions, which leads to a decrease in the rate of respiration and thus CO₂ production.
[2 marks]
Section C: Free-Response Questions (10 marks)
11. The greenhouse effect is a natural process where certain gases (e.g., CO₂, methane, water vapour) in the atmosphere trap heat from the sun, keeping the Earth warm enough to support life. Human activities, such as burning fossil fuels (releasing CO₂), deforestation (reducing CO₂ absorption), and agriculture (releasing methane and nitrous oxide), have significantly increased the concentration of these greenhouse gases. This intensifies the natural effect, leading to global warming and climate change. Impacts on ecosystems include: (1) Coral reefs: Increased ocean temperatures cause coral bleaching, where corals expel their symbiotic algae, leading to widespread death and loss of biodiversity. (2) Polar regions: Melting of sea ice reduces habitat for polar bears and seals, and alters the food web, affecting species from algae to top predators.
[10 marks]
12. Ecological succession on bare rock begins with pioneer species, such as lichens and mosses, which can colonise the harsh, nutrient-poor environment. They secrete acids that break down the rock, and when they die, their organic matter forms a thin layer of soil. This allows small plants and grasses to establish, which further develop the soil. Over time, shrubs and then trees (e.g., birch, pine) replace the smaller plants. Biodiversity increases throughout succession as more niches become available. The process culminates in a climax community, a stable, self-perpetuating ecosystem (e.g., a mature oak forest), where biodiversity is high and the species composition is relatively constant.
[5 marks]
13. Energy flows through an ecosystem in one direction. It enters as sunlight, is converted to chemical energy by producers (e.g., grass) via photosynthesis, and is then transferred to primary consumers (e.g., rabbit) when they eat the grass, and then to secondary consumers (e.g., fox). At each trophic level, energy is lost as heat through respiration and is not recycled. In contrast, matter (e.g., carbon, nitrogen) is cycled within the ecosystem. For example, carbon is taken up by plants as CO₂, passed to consumers, and returned to the atmosphere by respiration and decomposition, allowing it to be used again. Matter is finite and recycled, while energy is not.
[5 marks]
14. Initially, with abundant food and no predators, the rabbit population will exhibit exponential growth (J-shaped curve), where the population size increases rapidly. However, as the population grows, resources become limited. Factors such as food shortage, accumulation of waste, and increased competition for space will slow the growth rate. The population will then reach the carrying capacity of the island, where the birth rate equals the death rate, and the population size stabilises (S-shaped or logistic growth curve). The population size is ultimately limited by density-dependent factors like food availability and disease.
[5 marks]
15. Producers (e.g., plants, algae) are autotrophs that convert light energy into chemical energy through photosynthesis, forming the base of the food web. Consumers (e.g., herbivores like rabbits, carnivores like lions) are heterotrophs that obtain energy by feeding on other organisms. Decomposers (e.g., bacteria, fungi) break down dead organic matter and waste, releasing inorganic nutrients back into the environment for producers to use. While producers and consumers are involved in energy transfer, decomposers are crucial for nutrient cycling. All three groups are interdependent; without decomposers, nutrients would remain locked in dead matter, and producers would not have the raw materials for photosynthesis.
[5 marks]
Section D: Data Analysis and Application (10 marks)
16. (a) This experiment demonstrates competitive exclusion (or the concept of the competitive exclusion principle).
[1 mark]
(b) The two barnacle species compete for space on the rocky shore. Semibalanus is a stronger competitor and outcompetes Chthamalus in the lower intertidal zone, restricting Chthamalus to the upper intertidal zone where Semibalanus cannot survive due to greater exposure to air and desiccation. When Semibalanus was removed, Chthamalus was able to expand into the lower zone, showing that its original distribution was limited by competition, not by its own physiological tolerance.
[4 marks]
17. (a) Ecosystem B has higher species diversity.
[1 mark]
(b) Ecosystem B has a higher species richness (50 species) compared to Ecosystem A (15 species), even though both have the same total number of individuals. Higher species richness generally indicates a more diverse and potentially more stable ecosystem. Ecosystem A, with fewer species, may be more vulnerable to disturbances because the loss of one species could have a greater impact on the ecosystem's function.
[4 marks]
18. (a) The percentage of energy transferred from the grass to the rabbit is (Energy in rabbit / Energy in grass) × 100 = (1,500 kJ / 15,000 kJ) × 100 = 10%.
[2 marks]
(b) The energy is not transferred efficiently because:
- Some of the grass is not eaten by the rabbit (e.g., roots, stems).
- Some of the grass that is eaten is not digested and is lost as faeces.
- A large portion of the absorbed energy is used by the rabbit for respiration (to maintain body temperature, move, etc.) and is lost as heat.
- Some energy is lost in excretory materials (urine).
[3 marks]
19. (a) The population growth of the lynx and snowshoe hare shows a classic predator-prey cycle. The hare population increases first, followed by an increase in the lynx population. The lynx population then declines as the hare population decreases due to predation, and the cycle repeats.
[2 marks]
(b) The relationship is a negative feedback loop. When the hare population is high, there is abundant food for lynx, allowing the lynx population to increase. As the lynx population grows, they prey heavily on hares, causing the hare population to decline. With fewer hares, the lynx population faces food shortage, leading to a decline in lynx numbers. This reduction in predation pressure allows the hare population to recover, and the cycle begins again.
[3 marks]
20. (a) The net primary productivity (NPP) of the forest is the gross primary productivity (GPP) minus the energy used by the plants for respiration. NPP = GPP - Respiration = 20,000 kJ/m²/yr - 12,000 kJ/m²/yr = 8,000 kJ/m²/yr.
[2 marks]
(b) The NPP represents the energy available to the primary consumers (herbivores) in the ecosystem. It is the rate at which plants store chemical energy as biomass, which can then be consumed by herbivores. The remaining energy (after respiration) is what supports the rest of the food web.
[2 marks]
End of Answers