From Real Exams Quiz
A Level H1 Biology Ecology Quiz
Free A Level H1 Biology Ecology quiz, Exam version, with questions, answers, and A Level-style practice for Singapore students.
These static practice materials are generated from the site's syllabus and paper-generation workflow, with source and model context shown so students and parents can evaluate the material before use.
Questions

Free quiz and exam paper access
Enter your details to view this paper
Your access is remembered on this device.
Answers
A-Level Biology H1 Quiz - Ecology: Answer Key
Total Marks: 40
Section A: Multiple-Choice Questions (Questions 1–5)
1. B) A group of individuals of the same species living in the same area at the same time
- Marks: 1
- Explanation: A population is defined as a group of individuals of the same species that live in the same area and can interbreed. Option A describes a community (all organisms, including different species). Option C describes a community interacting with the environment (an ecosystem). Option D describes a habitat.
- Common mistake: Confusing population with community. Remember: population = one species; community = multiple species.
2. A) The position an organism occupies in a food chain
- Marks: 1
- Explanation: A trophic level is the feeding level or position of an organism in a food chain. Producers are at the first trophic level, primary consumers at the second, and so on. Option B refers to population size, C refers to energy transfer efficiency, and D refers to habitat.
- Common mistake: Thinking trophic level refers to the amount of energy, not the position.
3. C) Photosynthesis
- Marks: 1
- Explanation: Photosynthesis is the process by which plants (producers) take in carbon dioxide from the atmosphere and convert it into organic compounds (glucose). This is the primary route for carbon to enter living organisms. Respiration (A) releases CO₂ back to the atmosphere. Combustion (B) also releases CO₂. Decomposition (D) releases CO₂ from dead matter.
- Common mistake: Confusing photosynthesis (carbon uptake) with respiration (carbon release).
4. C) 10%
- Marks: 1
- Explanation: Energy transferred from producers to secondary consumers = energy from rabbit to fox = 1,000 kJ. Energy from producers (grass) = 100,000 kJ. Percentage = (1,000 / 100,000) × 100% = 1%. Wait, let's re-check. The question asks for energy transferred from producers to secondary consumer. The secondary consumer (fox) receives 1,000 kJ from the primary consumer (rabbit). The producers have 100,000 kJ. So percentage = (1,000 / 100,000) × 100% = 1%. However, the energy from producers to primary consumer is 10,000 kJ (10% efficiency), and from primary to secondary consumer is 1,000 kJ (10% of 10,000). So overall from producers to secondary consumer: (1,000 / 100,000) × 100% = 1%. The answer is B) 1%.
- Correction: The correct answer is B) 1%.
- Common mistake: Forgetting to calculate the overall percentage from the base of the producers, not just the step between trophic levels.
5. C) Competition for food
- Marks: 1
- Explanation: Density-dependent factors are those whose effects on a population change with population density. Competition for food becomes more intense as population size increases, so it is density-dependent. Volcanic eruptions (A), droughts (B), and floods (D) are density-independent factors—they affect populations regardless of their density.
- Common mistake: Confusing density-dependent (biotic factors like competition, predation, disease) with density-independent (abiotic factors like natural disasters, weather).
Section B: Short-Answer Questions (Questions 6–10)
6. State two abiotic factors that could affect the distribution of a plant species in a coastal ecosystem. [2]
- Marks: 2 (1 mark for each correct factor)
- Acceptable answers (any two):
- Salinity (salt concentration in soil/water)
- Wind speed/strength
- Soil type/nutrient content
- Light intensity
- Temperature
- Water availability/moisture
- pH of soil
- Wave action/tidal exposure
- Explanation: Abiotic factors are non-living physical and chemical components of the environment. In a coastal ecosystem, plants must tolerate high salt levels, strong winds, sandy soil, and varying water availability.
- Common mistake: Giving biotic factors (e.g., competition, predation) instead of abiotic factors.
7. Explain the difference between a niche and a habitat. [2]
- Marks: 2 (1 mark for each correct definition with clear distinction)
- Answer:
- A habitat is the physical place/environment where an organism lives (e.g., a forest, a pond). [1]
- A niche is the role/function of an organism within its ecosystem, including its interactions with biotic and abiotic factors, its feeding relationships, and its habitat requirements. [1]
- Explanation: Think of it this way: a habitat is an organism's "address," while a niche is its "profession" or "job" in the ecosystem. The niche includes what it eats, what eats it, when it is active, and how it reproduces.
- Common mistake: Stating that niche and habitat are the same thing.
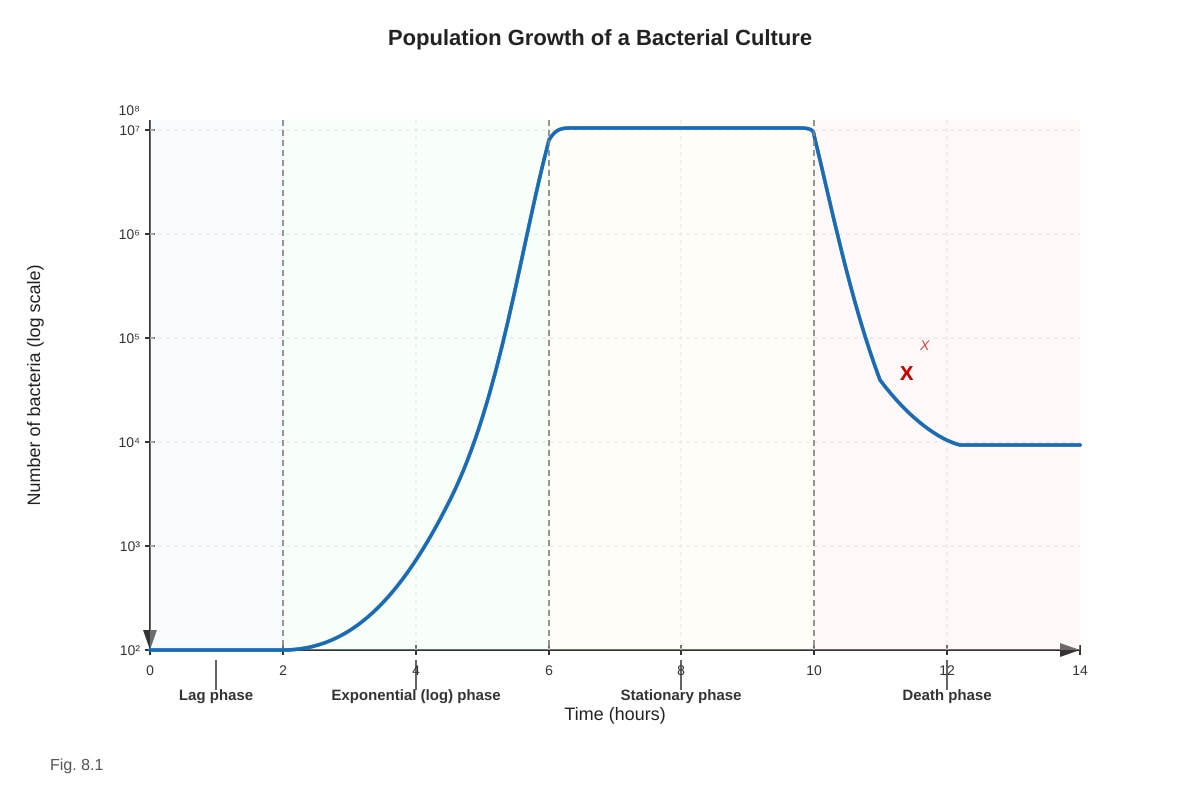
8. (a) Identify the phase labelled X on the graph. [1]
- Marks: 1
- Answer: Stationary phase (or plateau phase)
- Explanation: The stationary phase is the period where the birth rate equals the death rate, so the population size remains constant. On the graph, this is the flat part of the curve after the exponential growth phase.
(b) Explain why the population enters the stationary phase. [2]
- Marks: 2
- Answer: The population enters the stationary phase because resources (e.g., nutrients, space) become limiting as the population size increases. [1] The birth rate decreases and/or the death rate increases until they are equal, resulting in no net change in population size. [1]
- Explanation: In a closed system like a bacterial culture, exponential growth cannot continue indefinitely. As nutrients are depleted and waste products accumulate, the environment becomes less favourable, slowing growth until it stabilises.
- Common mistake: Only stating "resources run out" without explaining the effect on birth/death rates.
9. Describe how energy flows through an ecosystem, starting from the sun. [3]
- Marks: 3
- Answer:
- Energy from the sun is captured by producers (plants/algae) through photosynthesis and converted into chemical energy (organic compounds). [1]
- This energy is transferred to primary consumers (herbivores) when they eat producers, then to secondary consumers (carnivores) when they eat primary consumers, and so on along the food chain. [1]
- At each trophic level, energy is lost as heat through respiration, and through waste, uneaten parts, and movement. This means energy flow is one-way and decreases at each trophic level. [1]
- Explanation: Energy flow is unidirectional—it enters as sunlight, is converted to chemical energy, passes through trophic levels, and is eventually lost as heat. It cannot be recycled.
- Common mistake: Saying energy is recycled (nutrients are recycled, but energy flows one way).
10. Explain the trend in the data. [2]
- Marks: 2
- Answer: The rate of decomposition increases with temperature from 5°C to 35°C because higher temperatures increase the kinetic energy of molecules, speeding up the metabolic reactions of decomposers (e.g., bacteria and fungi). [1] However, at 45°C, the rate decreases because the temperature is too high, causing enzymes in the decomposers to denature, reducing their activity. [1]
- Explanation: Decomposition is carried out by microorganisms whose enzyme activity is temperature-dependent. The optimum temperature for many decomposers is around 35°C. Above this, enzymes denature and activity drops.
- Common mistake: Only describing the increase without explaining the decrease at high temperature.
Section C: Data-Based and Structured Questions (Questions 11–15)
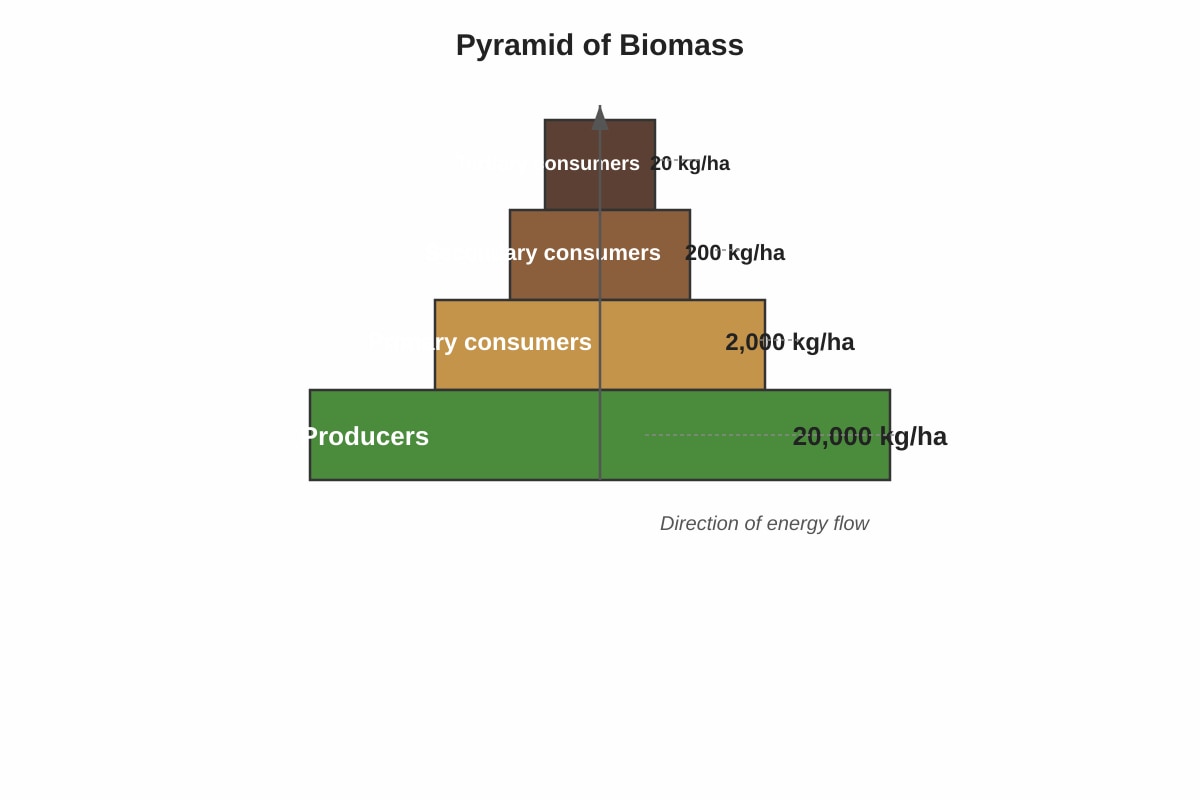
11. (a) Construct a pyramid of biomass using the data above. [2]
- Marks: 2
- Answer: The pyramid should be drawn with four rectangular blocks stacked vertically. The bottom block (Producers) is the largest, labelled "Producers – 20,000 kg/ha". Above it, a smaller block labelled "Primary consumers – 2,000 kg/ha". Above that, an even smaller block labelled "Secondary consumers – 200 kg/ha". At the top, the smallest block labelled "Tertiary consumers – 20 kg/ha".
- Marking scheme:
- [1] Correct relative sizes of blocks (decreasing from bottom to top)
- [1] Correct labels (trophic levels and biomass values)
- Explanation: A pyramid of biomass represents the total mass of living organisms at each trophic level at a given time. The decreasing size shows that less biomass is supported at higher trophic levels.
(b) Explain why the biomass decreases at each successive trophic level. [2]
- Marks: 2
- Answer: Biomass decreases because energy is lost at each trophic level. [1] Energy is lost through respiration (as heat), excretion (waste products), and uneaten/dead material that is not consumed by the next trophic level. This means less energy is available to support biomass at higher trophic levels. [1]
- Explanation: Only about 10% of the energy from one trophic level is transferred to the next. The rest is used for metabolism (respiration) or lost as waste. Since biomass is a measure of stored chemical energy, less energy means less biomass can be supported.
- Common mistake: Saying energy is "used up" without specifying how (respiration, heat loss, waste).
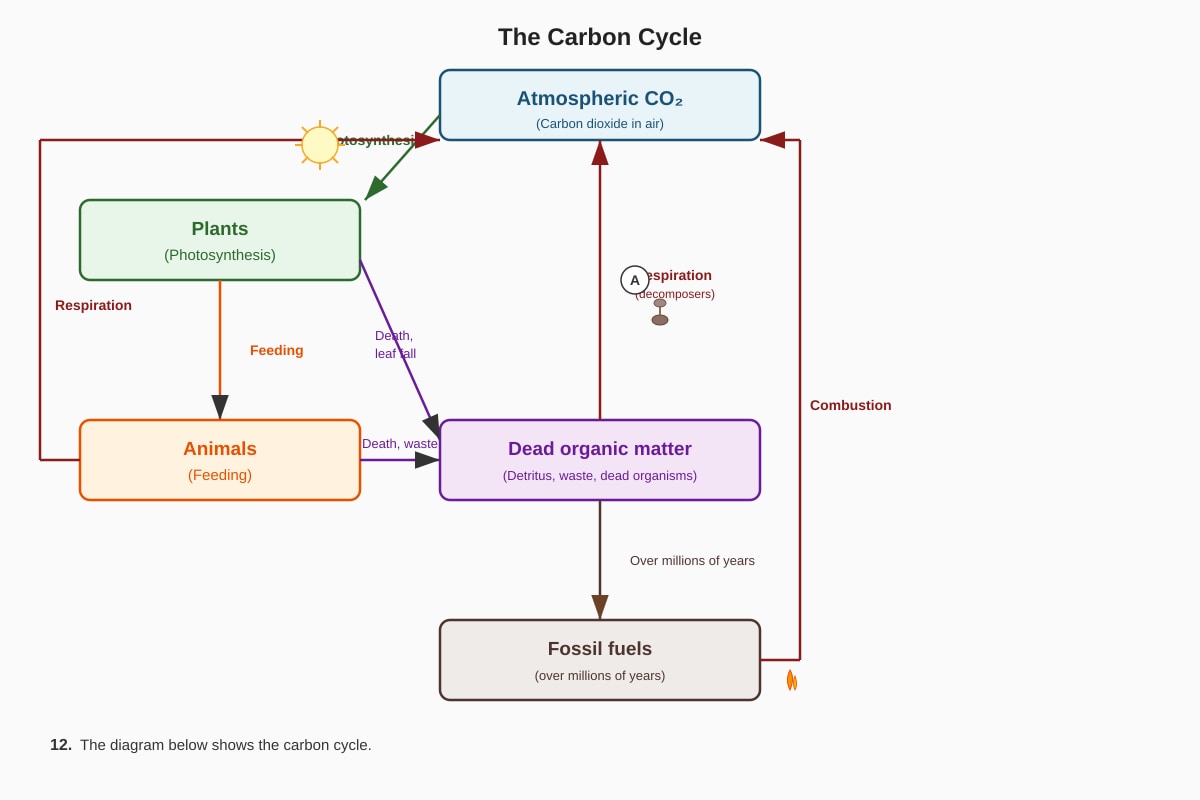
12. (a) Name the process labelled A. [1]
- Marks: 1
- Answer: Respiration (or cellular respiration)
- Explanation: The arrow from "Animals" to "Atmospheric CO₂" represents the release of carbon dioxide by animals through respiration. This is how carbon returns from consumers to the atmosphere.
(b) Describe the role of decomposers in the carbon cycle. [2]
- Marks: 2
- Answer: Decomposers (bacteria and fungi) break down dead organic matter (dead plants and animals). [1] During decomposition, they respire, releasing carbon dioxide back into the atmosphere. [1]
- Explanation: Decomposers are essential for recycling carbon. Without them, carbon would remain locked up in dead organisms and not be available for new plant growth.
- Common mistake: Saying decomposers only break down matter without mentioning the release of CO₂.
13. (a) Define the term "carrying capacity". [1]
- Marks: 1
- Answer: Carrying capacity is the maximum population size of a species that an environment can sustain indefinitely, given the available resources (e.g., food, water, space).
- Explanation: It is the upper limit of population growth set by limiting factors in the environment.
- Common mistake: Confusing carrying capacity with population size or growth rate.
(b) State one factor that could cause the carrying capacity to decrease. [1]
- Marks: 1
- Acceptable answers (any one):
- A decrease in food supply
- A decrease in available water
- Loss of habitat/space
- Increased competition from other species
- Disease outbreak
- Pollution
- Explanation: Any factor that reduces the availability of resources or increases mortality will lower the maximum population the environment can support.
- Common mistake: Giving a factor that affects population growth but not carrying capacity (e.g., a one-time flood).
14. (a) Calculate the ratio of species richness in the tropical rainforest to that in the temperate grassland. [1]
- Marks: 1
- Answer: Ratio = 250 : 80 = 25 : 8 (or 3.125 : 1)
- Explanation: Species richness is simply the number of different species. The ratio is calculated by dividing the rainforest value by the grassland value: 250/80 = 3.125. So the ratio is 25:8 or 3.125:1.
- Common mistake: Reversing the ratio (grassland to rainforest).
(b) Suggest one reason why the tropical rainforest has a higher species richness. [1]
- Marks: 1
- Acceptable answers (any one):
- More stable climate (consistent temperature and rainfall year-round)
- Higher primary productivity (more energy available to support more species)
- Greater habitat complexity (more niches available)
- Longer evolutionary time (older, undisturbed ecosystem)
- Explanation: Tropical rainforests have ideal conditions for life: warm temperatures, high rainfall, and abundant sunlight year-round. This allows for high productivity and supports a greater diversity of species.
- Common mistake: Giving a vague answer like "it's bigger" without a specific ecological reason.
15. Explain how the greenhouse effect contributes to global warming and describe one potential impact of global warming on an ecosystem. [3]
- Marks: 3
- Answer:
- The greenhouse effect is a natural process where greenhouse gases (e.g., CO₂, methane) in the atmosphere trap heat from the sun, keeping the Earth warm. [1]
- Human activities (e.g., burning fossil fuels, deforestation) have increased the concentration of greenhouse gases, enhancing the greenhouse effect and causing global temperatures to rise (global warming). [1]
- One potential impact on an ecosystem: (any one)
- Coral bleaching due to increased sea temperatures, destroying coral reef ecosystems.
- Changes in migration patterns of birds or animals.
- Loss of habitat for species adapted to cold climates (e.g., polar bears).
- Increased frequency of wildfires, destroying forest ecosystems.
- Changes in plant flowering times, disrupting food webs. [1]
- Explanation: The greenhouse effect itself is natural and necessary, but human-enhanced greenhouse effect leads to global warming. The impacts are wide-ranging and can disrupt entire ecosystems.
- Common mistake: Confusing the greenhouse effect (natural) with global warming (enhanced effect). Also, giving a vague impact without linking it to a specific ecosystem.
Section D: Extended-Response Questions (Questions 16–20)
16. Describe how energy and nutrients differ in their movement through an ecosystem. [2]
- Marks: 2
- Answer:
- Energy flows through an ecosystem in one direction: it enters as sunlight, is transferred through trophic levels, and is eventually lost as heat. It cannot be recycled. [1]
- Nutrients (e.g., carbon, nitrogen, phosphorus) are cycled within an ecosystem: they are taken up by organisms, passed through food chains, and returned to the environment by decomposers, where they can be reused. [1]
- Explanation: This is a fundamental concept in ecology. Energy flow is linear and non-recyclable, while nutrient flow is cyclical. Think of energy as "spent" money and nutrients as "reusable" resources.
- Common mistake: Saying both energy and nutrients are cycled.
17. A farmer notices that the population of aphids (pests) in his crop field increases rapidly at the start of the growing season but then stabilises. Using your knowledge of population growth, explain this pattern. [3]
- Marks: 3
- Answer:
- At the start of the growing season, there are abundant resources (food from new plant growth) and few limiting factors, so the aphid population undergoes exponential growth (J-shaped curve). [1]
- As the population increases, resources become limiting (e.g., food supply decreases, space becomes crowded). Density-dependent factors like competition for food and increased predation (e.g., by ladybirds) come into effect. [1]
- The population eventually reaches the carrying capacity of the field, where the birth rate equals the death rate, and the population size stabilises (S-shaped/logistic growth curve). [1]
- Explanation: This is a classic example of logistic population growth. The initial rapid growth is due to abundant resources, but as the population approaches the carrying capacity, growth slows and stabilises.
- Common mistake: Only describing exponential growth without mentioning the stabilisation phase or limiting factors.
18. Explain how the process of succession leads to the formation of a climax community. [3]
- Marks: 3
- Answer:
- Succession is the gradual change in the species composition of a community over time. It begins with pioneer species (e.g., lichens, mosses) colonising a bare area. [1]
- Pioneer species modify the environment (e.g., by breaking down rock to form soil, adding organic matter), making it more suitable for other species. These later species outcompete the pioneers, leading to a series of seral stages (intermediate communities). [1]
- Eventually, a stable, self-sustaining climax community is reached, where the species composition remains relatively constant unless disturbed by an external factor (e.g., fire, human activity). [1]
- Explanation: Succession is a directional process. Each stage changes the environment, allowing new species to establish and outcompete the previous ones. The climax community is the final, stable stage.
- Common mistake: Confusing primary succession (starting from bare rock) with secondary succession (starting from existing soil). Also, forgetting to mention the role of pioneer species in modifying the environment.
19. Discuss the role of nitrogen-fixing bacteria in the nitrogen cycle and explain why this process is essential for plant growth. [3]
- Marks: 3
- Answer:
- Nitrogen-fixing bacteria (e.g., Rhizobium in root nodules of legumes, or free-living Azotobacter in soil) convert atmospheric nitrogen gas (N₂) into ammonia (NH₃) or ammonium ions (NH₄⁺). [1]
- This is essential because atmospheric nitrogen (N₂) is very stable and cannot be directly used by plants. Plants can only absorb nitrogen in the form of nitrate ions (NO₃⁻) or ammonium ions (NH₄⁺). [1]
- Nitrogen is a key component of proteins, nucleic acids (DNA, RNA), and ATP. Without nitrogen fixation, plants would be unable to obtain the nitrogen they need for growth, and the entire ecosystem would be nitrogen-limited. [1]
- Explanation: Nitrogen fixation is the first step in making atmospheric nitrogen available to living organisms. It is carried out by specialised bacteria that have the enzyme nitrogenase. This process is crucial because nitrogen is a limiting nutrient in many ecosystems.
- Common mistake: Confusing nitrogen fixation (N₂ → NH₃) with nitrification (NH₃ → NO₂⁻ → NO₃⁻). Also, forgetting to state why plants need nitrogen (for proteins and nucleic acids).
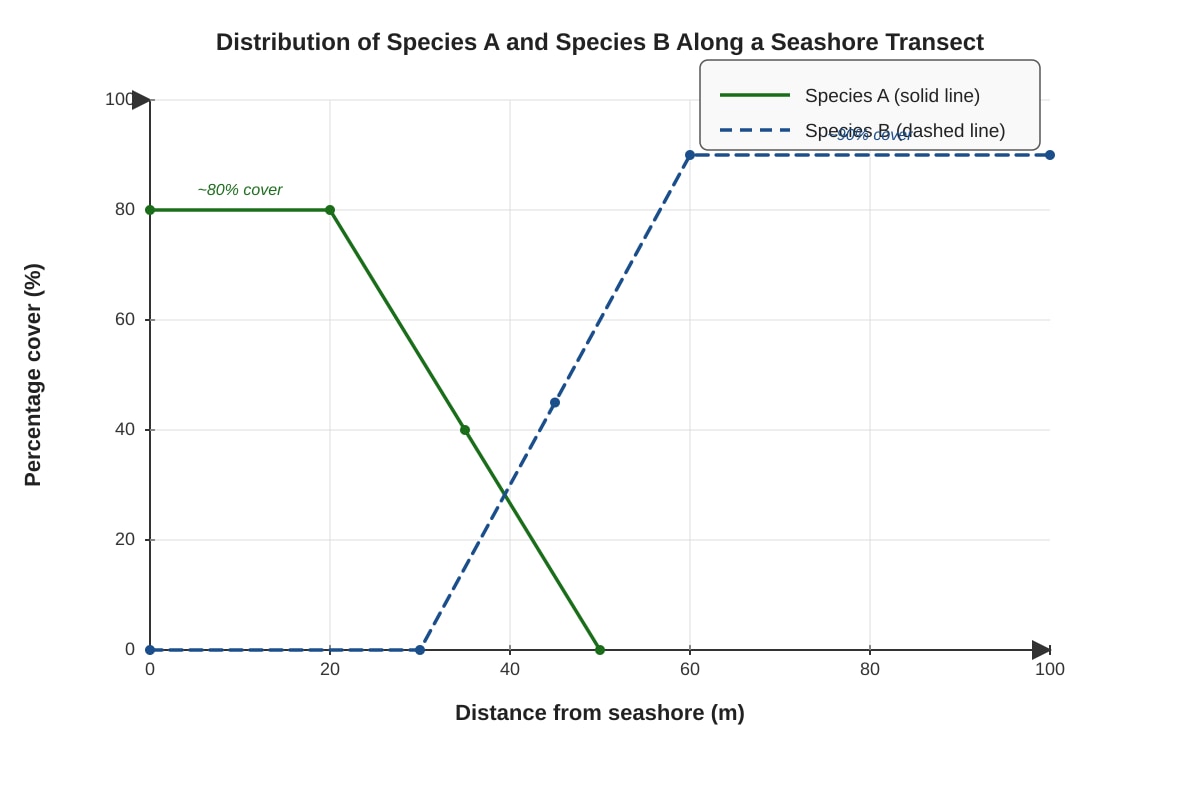
20. (a) Describe the distribution of Species A and Species B along the transect. [2]
- Marks: 2
- Answer:
- Species A is found mainly near the seashore (0–20 m), with high percentage cover (80%), and its cover decreases sharply with distance, disappearing by 50 m. [1]
- Species B is absent near the seashore (0–30 m), but its percentage cover increases from 30 m onwards, reaching a high cover (90%) further inland (60–100 m). [1]
- Explanation: The two species show a clear zonation pattern. Species A is adapted to conditions near the shore (e.g., high salt, wind), while Species B is adapted to conditions further inland (e.g., lower salt, more stable soil).
- Common mistake: Describing only one species or giving a vague description without specific distances.
(b) Suggest one abiotic factor that could explain the distribution pattern of these two species. [1]
- Marks: 1
- Acceptable answers (any one):
- Salinity – Species A is salt-tolerant (halophyte), while Species B cannot tolerate high salt levels.
- Wind exposure – Species A is adapted to strong winds near the shore, while Species B prefers sheltered conditions.
- Soil type – Sandy, well-drained soil near the shore vs. more developed soil inland.
- Water availability – Species A may tolerate drier conditions, while Species B requires more moisture.
- Explanation: The seashore-to-inland gradient involves changes in multiple abiotic factors. The most likely is salinity, as salt spray and tidal flooding create a high-salinity zone near the shore that only salt-tolerant plants can survive in.
- Common mistake: Giving a biotic factor (e.g., competition) without considering the primary abiotic gradient.