AI Generated Exam Paper
A Level H1 Biology Practice Paper 5
Free A Level H1 Biology Practice Paper 5, LongCat AI version, with questions, answers, and A Level-style practice for Singapore students.
These static practice materials are generated from the site's syllabus and paper-generation workflow, with source and model context shown so students and parents can evaluate the material before use.
Questions
TuitionGoWhere Practice Paper - Biology H1 A-Level
TuitionGoWhere Practice Paper (AI)
Subject: Biology Level: A-Level H1 Paper: Practice Paper (Cells & Biomolecules Focus) Duration: 1 hour 30 minutes Total Marks: 60 Version: 5 of 5 Name: ___________________________ Class: ___________________________ Date: ___________________________
Instructions
- Answer all questions in the spaces provided.
- Write your answers in the spaces provided or on lined paper if additional space is needed.
- The number of marks for each question or part-question is shown in brackets [ ].
- You are advised to spend approximately 45 minutes on Section A and 45 minutes on Section B.
- Where a question requires an explanation or description, answers should be written in clear, concise sentences using appropriate biological terminology.
Section A: Structured Questions [30 marks]
Answer all questions in this section.
Question 1 [3 marks]
Fig. 1.1 shows a transmission electron micrograph of a eukaryotic cell.
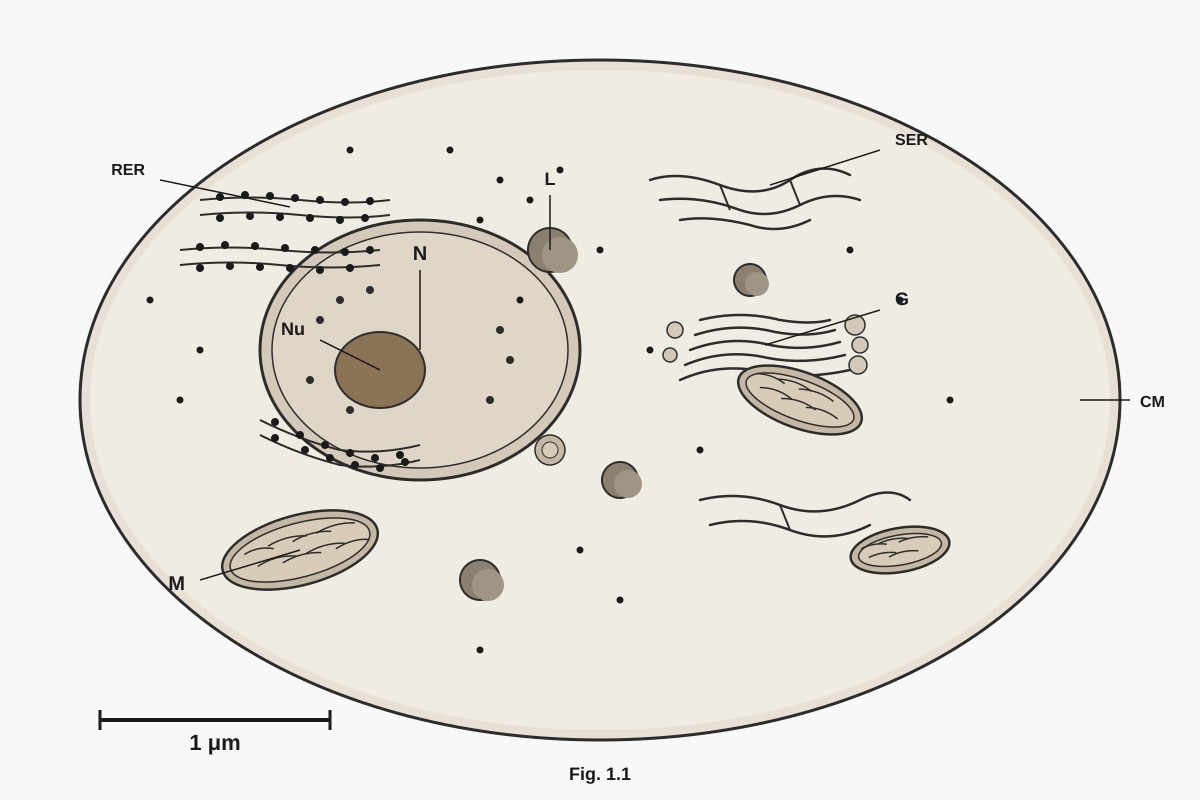
Generated figure for Q1.
Fig. 1.1
(a) Identify the organelle labelled M and state one structural feature visible in Fig. 1.1 that enables it to carry out its function. [2 marks]
...........................................................................................................................................................
...........................................................................................................................................................
(b) State the function of the organelle labelled RER. [1 mark]
...........................................................................................................................................................
Question 2 [4 marks]
(a) Describe the fluid mosaic model of the cell membrane. [3 marks]
...........................................................................................................................................................
...........................................................................................................................................................
...........................................................................................................................................................
...........................................................................................................................................................
...........................................................................................................................................................
(b) Explain why the cell membrane is described as "selectively permeable." [1 mark]
...........................................................................................................................................................
...........................................................................................................................................................
Question 3 [3 marks]
Table 3.1 shows the relative concentrations of three ions inside and outside a typical mammalian cell.
Table 3.1
| Ion | Intracellular concentration (mmol dm⁻³) | Extracellular concentration (mmol dm⁻³) |
|---|---|---|
| Na⁺ | 12 | 145 |
| K⁺ | 140 | 4 |
| Ca²⁺ | 0.0001 | 2.5 |
(a) With reference to Table 3.1, identify which ion has the steepest concentration gradient across the cell membrane. Show your reasoning. [2 marks]
...........................................................................................................................................................
...........................................................................................................................................................
...........................................................................................................................................................
(b) Explain how the sodium-potassium pump maintains the concentration gradients shown in Table 3.1. [1 mark]
...........................................................................................................................................................
...........................................................................................................................................................
Question 4 [4 marks]
Fig. 4.1 shows the effect of temperature on the rate of an enzyme-catalysed reaction.
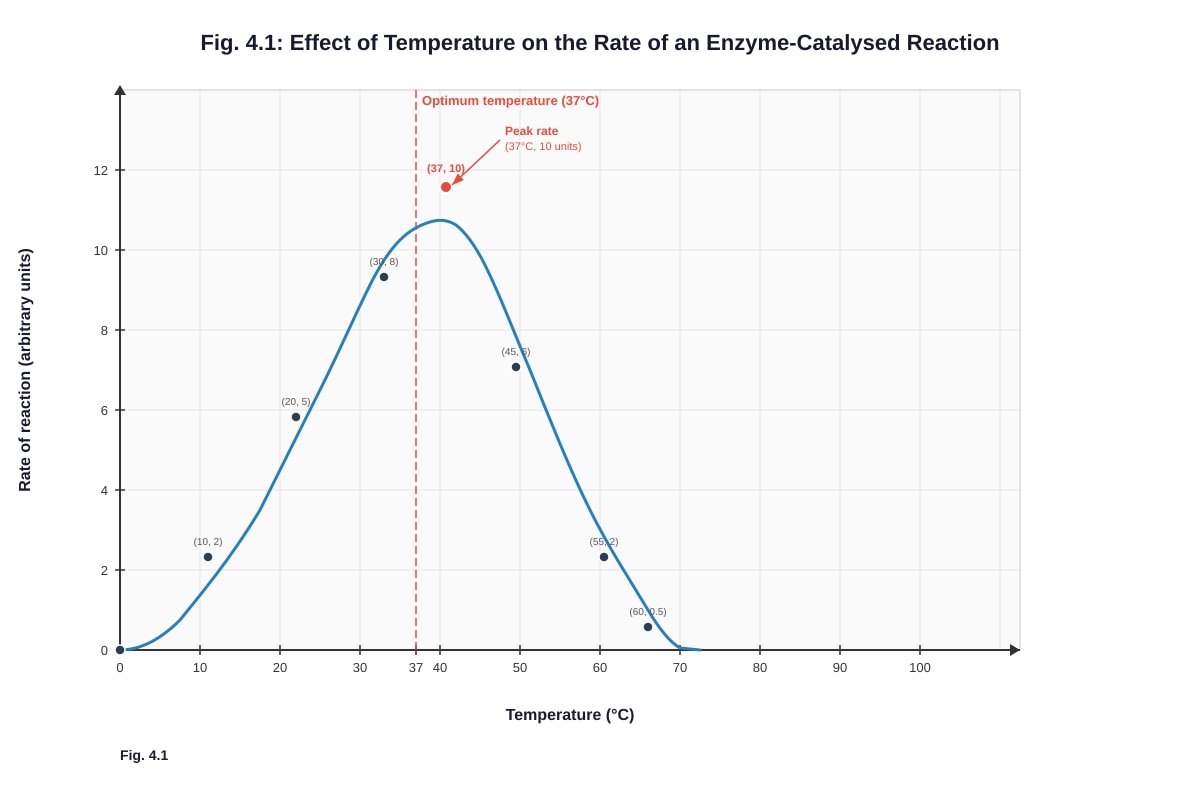
Generated graph for Q4.
Fig. 4.1
(a) Describe the relationship between temperature and the rate of reaction as shown in Fig. 4.1. [2 marks]
...........................................................................................................................................................
...........................................................................................................................................................
...........................................................................................................................................................
(b) Explain the decrease in the rate of reaction above 37°C. [2 marks]
...........................................................................................................................................................................................................................
...........................................................................................................................................................
...........................................................................................................................................................
Question 5 [3 marks]
Distinguish between competitive and non-competitive enzyme inhibition. In your answer, refer to the effect on Vmax and Km for each type of inhibition.
...........................................................................................................................................................
...........................................................................................................................................................
...........................................................................................................................................................
...........................................................................................................................................................
...........................................................................................................................................................
...........................................................................................................................................................
Question 6 [4 marks]
(a) State two structural differences between prokaryotic and eukaryotic cells. [2 marks]
...........................................................................................................................................................
...........................................................................................................................................................
...........................................................................................................................................................
(b) A scientist observes a cell under an electron microscope and notes the presence of a cell wall, ribosomes, and a nucleoid region, but no membrane-bound organelles. State what type of cell this is and explain your reasoning. [2 marks]
...........................................................................................................................................................
...........................................................................................................................................................
...........................................................................................................................................................
Question 7 [4 marks]
Fig. 7.1 shows the process of osmosis in plant cells placed in solutions of different sucrose concentrations.
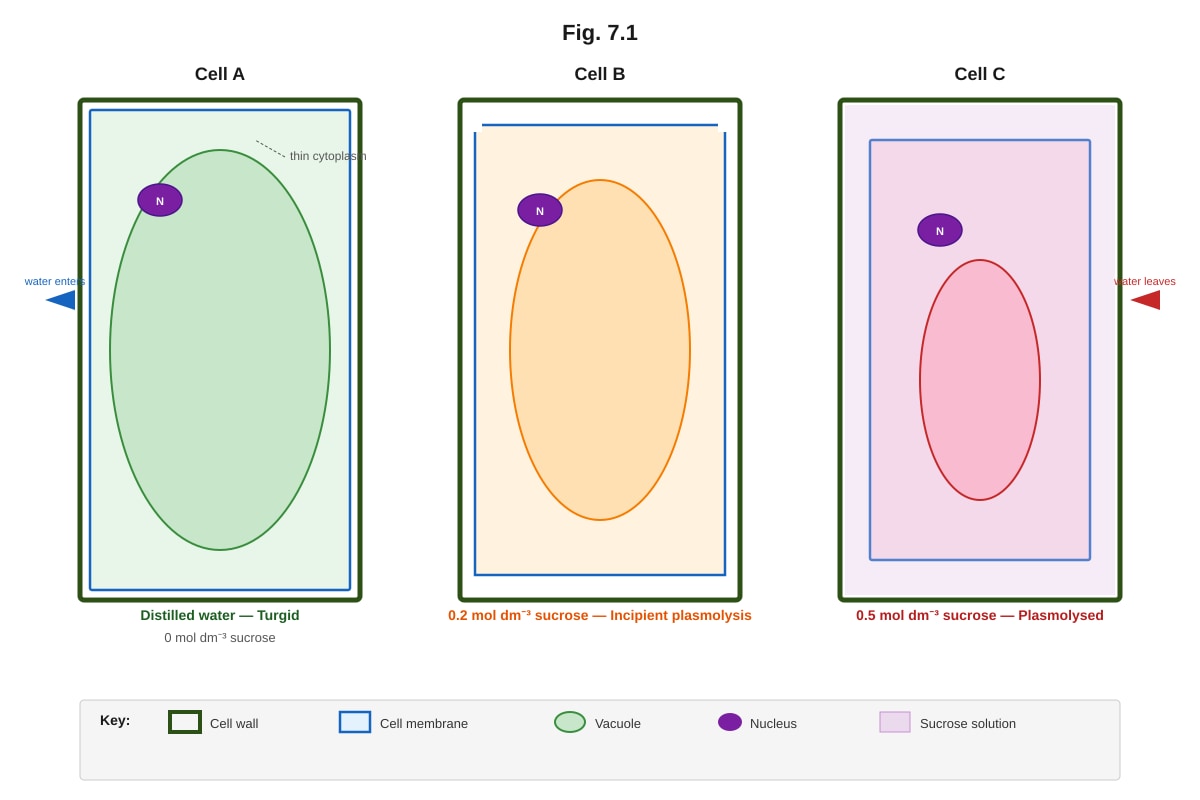
Generated diagram for Q7.
Fig. 7.1
(a) With reference to Fig. 7.1, explain why Cell A is turgid. [2 marks]
...........................................................................................................................................................
...........................................................................................................................................................
...........................................................................................................................................................
(b) The scientist determines that the solute potential of the cell sap is equivalent to 0.2 mol dm⁻³ sucrose. Explain what is observed in Cell B. [2 marks]
...........................................................................................................................................................
...........................................................................................................................................................
...........................................................................................................................................................
Question 8 [5 marks]
Describe the structure of DNA, including the arrangement of nucleotides, the sugar-phosphate backbone, and the nature of the double helix. Explain how the structure of DNA enables it to carry genetic information and undergo replication.
...........................................................................................................................................................
...........................................................................................................................................................
...........................................................................................................................................................
...........................................................................................................................................................
...........................................................................................................................................................
...........................................................................................................................................................
...........................................................................................................................................................
...........................................................................................................................................................
...........................................................................................................................................................
...........................................................................................................................................................
...........................................................................................................................................................
Section B: Data-Based and Application Questions [30 marks]
Answer all questions in this section.
Question 9 [6 marks]
An experiment was conducted to investigate the effect of pH on the activity of the enzyme pepsin. The enzyme was incubated with its substrate (protein) at different pH values for 10 minutes, and the amount of product formed was measured. The results are shown in Table 9.1.
Table 9.1
| pH | Amount of product formed (mg) |
|---|---|
| 1.0 | 8.2 |
| 1.5 | 12.6 |
| 2.0 | 15.0 |
| 2.5 | 11.3 |
| 3.0 | 7.8 |
| 4.0 | 3.1 |
| 5.0 | 0.8 |
| 6.0 | 0.2 |
| 7.0 | 0.0 |
(a) Plot a graph of the amount of product formed against pH on the grid provided below. [3 marks]
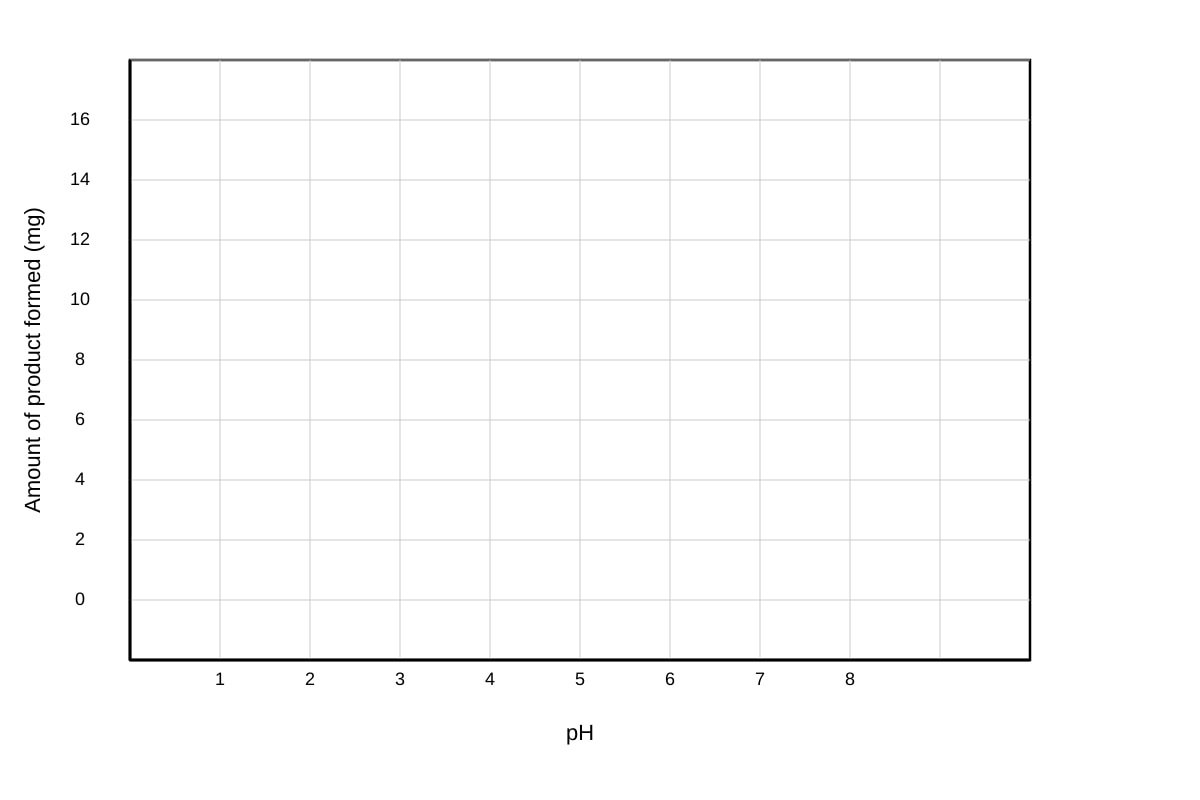
Generated graph for Q9.
(b) From your graph, determine the optimum pH for pepsin and explain why pepsin shows this pH preference. [2 marks]
...........................................................................................................................................................
...........................................................................................................................................................
...........................................................................................................................................................
(c) Predict the amount of product formed at pH 8.0 and explain your prediction. [1 mark]
...........................................................................................................................................................
...........................................................................................................................................................
Question 10 [5 marks]
Fig. 10.1 shows the structure of a phospholipid molecule.
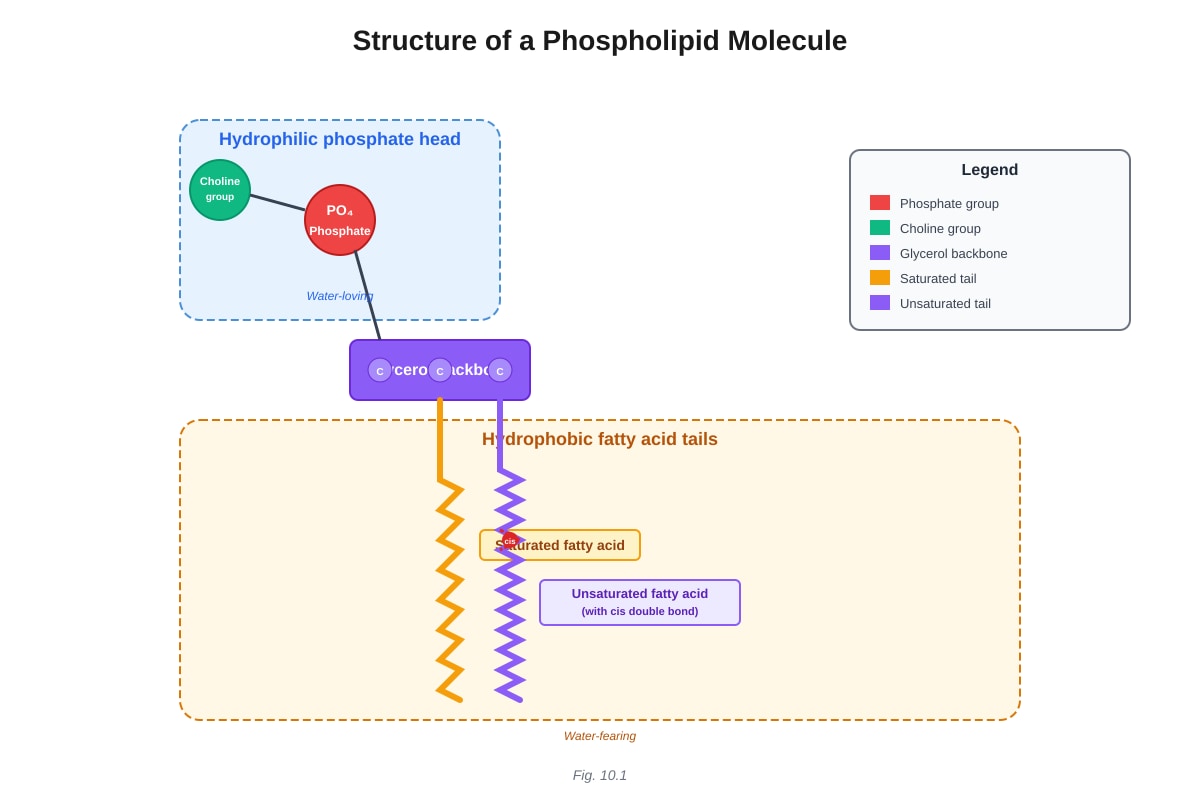
Generated diagram for Q10.
Fig. 10.1
(a) With reference to Fig. 10.1, explain how phospholipids are arranged in the cell membrane and why this arrangement occurs. [3 marks]
...........................................................................................................................................................
...........................................................................................................................................................
...........................................................................................................................................................
...........................................................................................................................................................
...........................................................................................................................................................
(b) Explain the role of cholesterol in the cell membrane. [2 marks]
...........................................................................................................................................................
...........................................................................................................................................................
...........................................................................................................................................................
Question 11 [5 marks]
A student carried out an experiment to test for the presence of different biological molecules in three unknown food samples (X, Y, and Z). The results are shown in Table 11.1.
Table 11.1
| Test | Reagent used | Sample X | Sample Y | Sample Z |
|---|---|---|---|---|
| Test for reducing sugar | Benedict's reagent (heated) | Blue | Brick-red precipitate | Blue |
| Test for starch | Iodine solution | Blue-black | Brown | Blue-black |
| Test for protein | Biuret reagent | Pale blue | Pale blue | Violet/purple |
| Test for lipid | Ethanol emulsion test | Clear | Cloudy white | Clear |
(a) Identify the biological molecules present in each sample. [3 marks]
Sample X: ...............................................................................................................................................
Sample Y: ...............................................................................................................................................
Sample Z: ...............................................................................................................................................
(b) Explain why Benedict's reagent requires heating to produce a positive result for reducing sugars. [2 marks]
...........................................................................................................................................................
...........................................................................................................................................................
...........................................................................................................................................................
Question 12 [6 marks]
Fig. 12.1 shows a summary of the processes involved in protein synthesis.
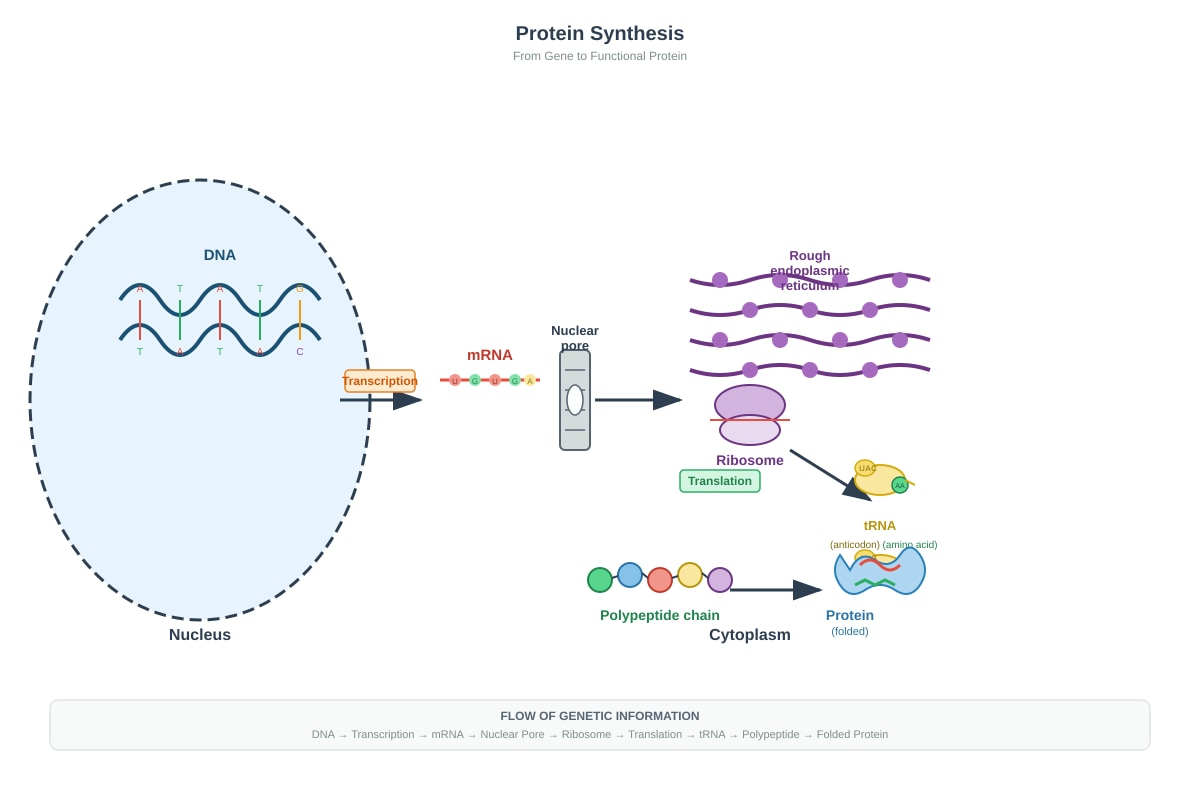
Generated diagram for Q12.
Fig. 12.1
(a) State where in the cell transcription occurs and name the enzyme responsible for this process. [2 marks]
...........................................................................................................................................................
...........................................................................................................................................................
(b) Describe the role of tRNA in translation. [2 marks]
...........................................................................................................................................................
...........................................................................................................................................................
...........................................................................................................................................................
(c) Explain why proteins destined for secretion are synthesised on ribosomes attached to the rough endoplasmic reticulum rather than free ribosomes in the cytoplasm. [2 marks]
...........................................................................................................................................................
...........................................................................................................................................................
...........................................................................................................................................................
Question 13 [4 marks]
(a) Describe the structure of an amino acid and explain how amino acids are joined together to form a polypeptide. [3 marks]
...........................................................................................................................................................
...........................................................................................................................................................
...........................................................................................................................................................
...........................................................................................................................................................
...........................................................................................................................................................
(b) State the name of the bond formed between two amino acids. [1 mark]
...........................................................................................................................................................
Question 14 [4 marks]
Fig. 14.1 shows the effect of substrate concentration on the rate of an enzyme-catalysed reaction in the absence and presence of a competitive inhibitor.
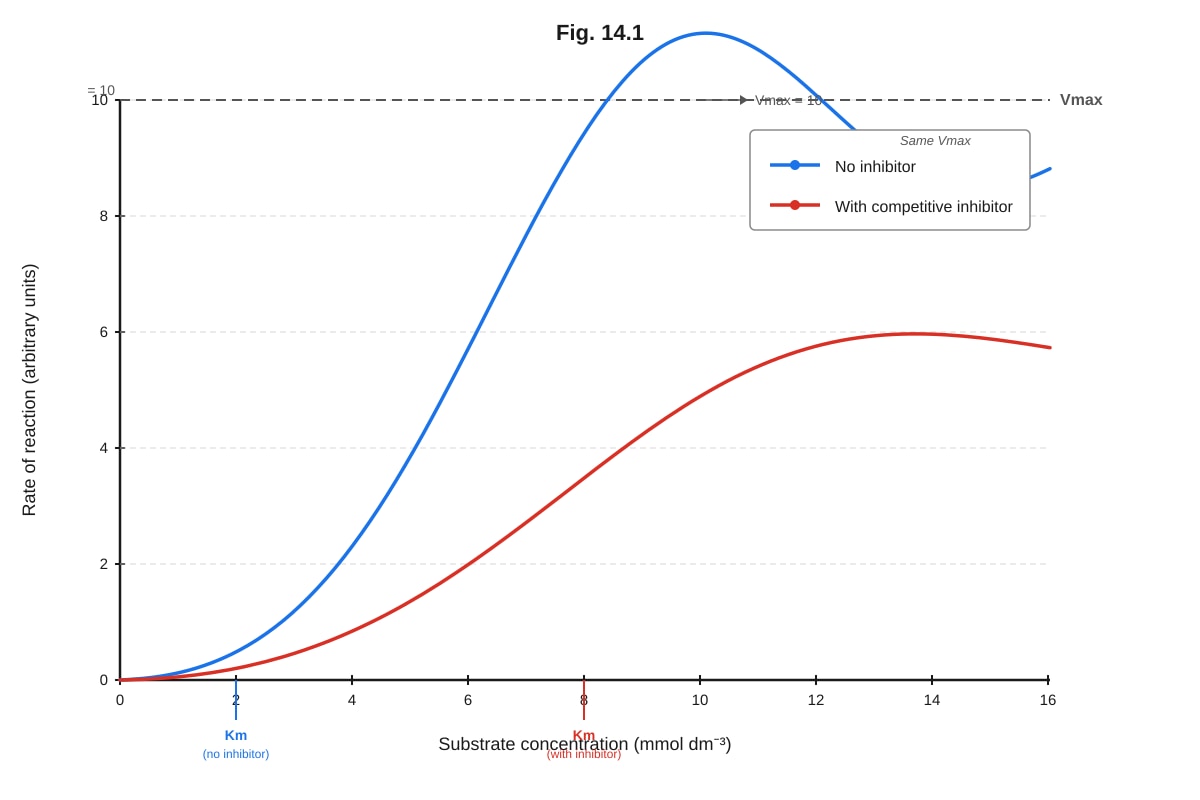
Generated graph for Q14.
Fig. 14.1
(a) With reference to Fig. 14.1, explain why both curves reach the same Vmax. [2 marks]
...........................................................................................................................................................
...........................................................................................................................................................
...........................................................................................................................................................
(b) Explain why a higher substrate concentration is required to reach Vmax in the presence of the competitive inhibitor. [2 marks]
...........................................................................................................................................................
...........................................................................................................................................................
........................................................................................................................................................---
End of Practice Paper
Summary of Marks
| Section | Marks |
|---|---|
| Section A (Questions 1–8) | 30 |
| Section B (Questions 9–14) | 30 |
| Total | 60 |
Answers
TuitionGoWhere Practice Paper - Biology H1 A-Level
Answer Key and Marking Scheme
Version: 5 of 5 Total Marks: 60
Section A: Structured Questions [30 marks]
Question 1 [3 marks]
(a) [2 marks]
Answer: Organelle M is the mitochondrion. [1 mark]
One structural feature visible that enables it to carry out its function: cristae (inner mitochondrial membrane folds), which increase the surface area for the attachment of enzymes and electron carriers involved in aerobic respiration / the electron transport chain. [1 mark]
Alternative acceptable features:
- Double membrane (inner membrane contains electron transport chain proteins)
- Presence of matrix (contains enzymes for the Krebs cycle)
Marking notes:
- 1 mark for correct identification as mitochondrion
- 1 mark for a valid structural feature linked to function
- The feature must be visible in the TEM image (cristae are clearly visible as internal folds)
Common mistakes:
- Students may confuse mitochondria with chloroplasts (chloroplasts have thylakoids/grana, not cristae)
- Students may state the function without linking it to a visible structural feature
(b) [1 mark]
Answer: The rough endoplasmic reticulum (RER) is the site of protein synthesis (by ribosomes on its surface) and protein folding / processing / transport of proteins. [1 mark]
Accept any one of the above.
Teaching note: The RER is distinguished from the smooth ER by the presence of ribosomes on its cytoplasmic surface. These ribosomes synthesise proteins that are either secreted from the cell, incorporated into membranes, or targeted to lysosomes. The RER also provides a compartment for proper protein folding and initial glycosylation.
Question 2 [4 marks]
(a) [3 marks]
Answer: The fluid mosaic model describes the cell membrane as:
-
A phospholipid bilayer in which phospholipids are arranged with their hydrophilic phosphate heads facing the aqueous environments (outside the cell and cytoplasm) and their hydrophobic fatty acid tails facing each other in the interior of the membrane. [1 mark]
-
The membrane is "fluid" because phospholipids can move laterally within their monolayer, giving the membrane flexibility and allowing it to self-seal. [1 mark]
-
The membrane is a "mosaic" because it contains various proteins (integral and peripheral), cholesterol, glycoproteins, and glycolipids scattered throughout the bilayer in an irregular pattern. [1 mark]
Marking notes:
- 1 mark for phospholipid bilayer description with correct orientation of heads and tails
- 1 mark for explanation of "fluid" nature (lateral movement of components)
- 1 mark for explanation of "mosaic" nature (variety of embedded components)
(b) [1 mark]
Answer: The cell membrane is selectively permeable because it allows small, non-polar molecules (e.g., oxygen, carbon dioxide) and water to pass freely through the phospholipid bilayer, but prevents or restricts the passage of large molecules, ions, and polar molecules, which require specific transport proteins to cross. [1 mark]
Teaching note: Selective permeability arises from the hydrophobic core of the phospholipid bilayer, which acts as a barrier to hydrophilic substances. Transport proteins (channels and carriers) provide selective pathways for specific molecules and ions.
Question 3 [3 marks]
(a) [2 marks]
Answer: Ca²⁺ (calcium ions) have the steepest concentration gradient. [1 mark]
Reasoning: The ratio of extracellular to intracellular concentration for Ca²⁺ is 2.5 / 0.0001 = 25,000:1, which is much steeper than Na⁺ (145/12 ≈ 12:1) or K⁺ (4/140 ≈ 1:35, or 35:1 in the opposite direction). [1 mark]
Working:
- Na⁺ gradient: 145 ÷ 12 = 12.1 (extracellular : intracellular)
- K⁺ gradient: 140 ÷ 4 = 35 (intracellular : extracellular)
- Ca²⁺ gradient: 2.5 ÷ 0.0001 = 25,000 (extracellular : intracellular)
Marking notes:
- 1 mark for correctly identifying Ca²⁺
- 1 mark for showing the calculation or correct ratio comparison
(b) [1 mark]
Answer: The sodium-potassium pump uses energy from ATP hydrolysis to actively transport 3 Na⁺ ions out of the cell and 2 K⁺ ions into the cell against their concentration gradients, maintaining the high intracellular K⁺ and high extracellular Na⁺ concentrations. [1 mark]
Teaching note: The Na⁺/K⁺ ATPase is an example of active transport. It is essential for maintaining the resting membrane potential, cell volume, and driving secondary active transport (co-transport) of other molecules such as glucose.
Question 4 [4 marks]
(a) [2 marks]
Answer: As temperature increases from 0°C to 37°C, the rate of reaction increases [½ mark], reaching a maximum (optimum) at 37°C [½ mark]. Above 37°C, the rate of reaction decreases rapidly [½ mark], approaching zero at 60°C [½ mark].
Marking notes:
- Award marks for describing both the increase and decrease phases
- Must identify 37°C as the optimum temperature
- Must note the sharp decline above the optimum
(b) [2 marks]
Answer: Above 37°C, the enzyme molecules gain excessive kinetic energy, which disrupts the hydrogen bonds, ionic bonds, and other non-covalent interactions that maintain the enzyme's tertiary structure / active site shape. [1 mark] This causes denaturation of the enzyme — the active site loses its specific shape and can no longer bind to the substrate effectively, so the rate of reaction decreases. [1 mark]
Teaching note: Denaturation is the loss of an enzyme's three-dimensional structure due to disruption of the weak bonds that stabilise its tertiary structure. It is typically irreversible. The sharp decline in activity above the optimum temperature reflects the cooperative nature of protein unfolding — once key bonds are broken, the entire structure rapidly collapses.
Question 5 [3 marks]
Answer:
| Feature | Competitive Inhibition | Non-competitive Inhibition |
|---|---|---|
| Site of binding | Inhibitor binds to the active site of the enzyme | Inhibitor binds to a different site (allosteric site) on the enzyme |
| Effect on Vmax | Vmax unchanged — can be reached by increasing substrate concentration | Vmax decreased — cannot be restored by adding more substrate |
| Effect on Km | Km increased — enzyme has lower apparent affinity for substrate | Km unchanged — enzyme's affinity for substrate is not affected |
| Mechanism | Inhibitor competes with substrate for the active site; structurally similar to substrate | Inhibitor changes the shape of the enzyme (including the active site) so substrate cannot bind effectively |
Marking notes:
- 1 mark for correctly describing competitive inhibition (binds active site, Vmax unchanged, Km increased)
- 1 mark for correctly describing non-competitive inhibition (binds allosteric site, Vmax decreased, Km unchanged)
- 1 mark for clear distinction between the two types with reference to Vmax and Km
Common mistakes:
- Confusing the effects on Vmax and Km between the two types
- Stating that competitive inhibition changes Vmax (it does not — it can be overcome by excess substrate)
Question 6 [4 marks]
(a) [2 marks]
Answer: Two structural differences:
-
Prokaryotic cells lack a membrane-bound nucleus (they have a nucleoid region instead), whereas eukaryotic cells have a true nucleus enclosed by a nuclear envelope. [1 mark]
-
Prokaryotic cells lack membrane-bound organelles (e.g., mitochondria, endoplasmic reticulum, Golgi apparatus), whereas eukaryotic cells possess these organelles. [1 mark]
Other acceptable differences:
- Prokaryotic cells are generally smaller (1–5 μm) than eukaryotic cells (10–100 μm)
- Prokaryotic ribosomes are 70S; eukaryotic ribosomes are 80S
- Prokaryotic cells have a cell wall made of peptidoglycan; eukaryotic plant cells have a cell wall made of cellulose
(b) [2 marks]
Answer: This is a prokaryotic cell. [1 mark]
Reasoning: The presence of a nucleoid region (instead of a membrane-bound nucleus) and the absence of membrane-bound organelles are characteristic features of prokaryotic cells. The presence of a cell wall and ribosomes is consistent with prokaryotes (all cells have ribosomes; prokaryotic cell walls are made of peptidoglycan). [1 mark]
Question 7 [4 marks]
(a) [2 marks]
Answer: Cell A is placed in distilled water, which has a higher water potential (less negative / closer to zero) than the cell sap inside the vacuole. [1 mark] Water molecules move into the cell by osmosis (from a region of higher water potential to a region of lower water potential across the selectively permeable membrane). The influx of water increases the volume of the vacuole, pushing the cytoplasm and cell membrane against the rigid cell wall, creating turgor pressure. [1 mark]
Teaching note: Turgor pressure is the pressure exerted by the cell contents against the cell wall. It is essential for maintaining the rigidity of plant tissues. The cell wall prevents the cell from bursting.
(b) [2 marks]
Answer: In Cell B, the external solution (0.2 mol dm⁻³ sucrose) has the same water potential as the cell sap (since the solute potential of the cell sap is equivalent to 0.2 mol dm⁻³ sucrose). [1 mark] There is no net movement of water into or out of the cell by osmosis. The cell is at incipient plasmolysis — the point at which the cell membrane just begins to pull away from the cell wall because there is no turgor pressure. [1 mark]
Teaching note: Incipient plasmolysis is the point at which the cell membrane loses contact with the cell wall. It occurs when the external solution is isotonic with the cell sap. This is an important concept for determining the solute potential of plant cell sap experimentally.
Question 8 [5 marks]
Answer:
Structure of DNA:
-
DNA is a double-stranded polynucleotide — each strand is made up of many nucleotide monomers linked together. [1 mark]
-
Each nucleotide consists of: a deoxyribose sugar, a phosphate group, and a nitrogenous base (adenine, thymine, guanine, or cytosine). [½ mark]
-
The two strands are held together by hydrogen bonds between complementary base pairs: A=T (2 hydrogen bonds) and G≡C (3 hydrogen bonds). [1 mark]
-
The strands are antiparallel — one runs 5'→3' and the other 3'→5'. The sugar-phosphate backbone forms the structural framework on the outside, with base pairs on the inside. [1 mark]
-
The molecule forms a right-handed double helix with approximately 10 base pairs per complete turn. [½ mark]
How structure enables function:
-
The complementary base pairing (A-T, G-C) allows each strand to serve as a template for the synthesis of a new complementary strand during semi-conservative replication, ensuring accurate copying of genetic information. [½ mark]
-
The sequence of bases along the DNA strand encodes genetic information — the specific order of A, T, G, and C determines the amino acid sequence of proteins. [½ mark]
Marking notes:
- Award marks for accurate description of nucleotide structure, base pairing, antiparallel arrangement, and double helix
- Award marks for explaining how structure relates to replication and information storage
- Maximum 5 marks
Section B: Data-Based and Application Questions [30 marks]
Question 9 [6 marks]
(a) [3 marks]
Marking criteria for graph:
- Axes correctly labelled with units (y-axis: "Amount of product formed (mg)"; x-axis: "pH") — [1 mark]
- Appropriate scale used on both axes (evenly spaced, covering the full range of data) — [1 mark]
- All points accurately plotted and a smooth curve drawn through the points — [1 mark]
Expected graph shape: Bell-shaped curve peaking at pH 2.0 with 15.0 mg product. The curve should show a steep rise from pH 1.0 to 2.0 and a gradual decline from pH 2.0 to 7.0.
(b) [2 marks]
Answer: The optimum pH for pepsin is pH 2.0 (where the maximum amount of product, 15.0 mg, is formed). [1 mark]
Explanation: Pepsin is a protease enzyme found in the stomach, where the pH is highly acidic (approximately pH 1.5–2.0 due to hydrochloric acid secretion). The enzyme's active site has amino acid residues that are ionised optimally at this low pH, allowing maximum substrate binding and catalytic activity. [1 mark]
(c) [1 mark]
Answer: At pH 8.0, the amount of product formed would be approximately 0 mg (or very close to zero). [½ mark]
Explanation: At pH 8.0 (alkaline conditions), pepsin would be completely denatured — the enzyme's tertiary structure and active site shape would be irreversibly disrupted, so no catalysis can occur. [½ mark]
Question 10 [5 marks]
(a) [3 marks]
Answer: Phospholipids in the cell membrane are arranged as a bilayer (double layer). [1 mark] The hydrophilic phosphate heads face the aqueous environments on both sides of the membrane (the extracellular fluid and the cytoplasm), while the hydrophobic fatty acid tails face each other in the interior of the membrane, away from water. [1 mark] This arrangement occurs because phospholipids are amphipathic molecules (having both hydrophilic and hydrophobic regions). In an aqueous environment, they spontaneously arrange themselves to shield the hydrophobic tails from water while exposing the hydrophilic heads to water — this is the most thermodynamically stable configuration. [1 mark]
Teaching note: The phospholipid bilayer forms spontaneously in water due to the hydrophobic effect. This is why cell membranes can self-assemble and self-seal.
(b) [2 marks]
Answer: Cholesterol molecules are embedded in the phospholipid bilayer, positioned between phospholipid molecules with their hydroxyl group near the phosphate heads and their rigid steroid ring structure interacting with the fatty acid tails. [1 mark] Cholesterol regulates membrane fluidity: at high temperatures, it restricts the movement of phospholipids, making the membrane less fluid and more stable; at low temperatures, it prevents the phospholipids from packing too closely together, maintaining fluidity. It also reduces membrane permeability to small water-soluble molecules and ions. [1 mark]
Question 11 [5 marks]
(a) [3 marks]
Sample X: Contains starch (positive iodine test: blue-black) and no reducing sugar, no protein, no lipid. [1 mark]
Sample Y: Contains reducing sugar (positive Benedict's test: brick-red precipitate) and lipid (positive ethanol emulsion test: cloudy white), but no starch (brown iodine) and no protein (pale blue Biuret). [1 mark]
Sample Z: Contains protein (positive Biuret test: violet/purple) and starch (positive iodine test: blue-black), but no reducing sugar and no lipid. [1 mark]
Marking notes:
- 1 mark per sample for correct identification of all present molecules
- Students must not claim the presence of molecules that tested negative
(b) [2 marks]
Answer: Benedict's reagent contains copper(II) sulfate (Cu²⁺ ions in an alkaline solution). Heating provides the activation energy required for the redox reaction to occur. [1 mark] Reducing sugars (such as glucose and maltose) reduce the blue Cu²⁺ ions to Cu⁺ ions, which form a brick-red precipitate of copper(I) oxide (Cu₂O). Without heating, the reaction rate is too slow to produce a visible colour change. [1 mark]
Teaching note: Benedict's test is a semi-quantitative test — the colour of the precipitate can indicate the approximate concentration of reducing sugar (green → yellow → orange → brick-red indicates increasing concentration).
Question 12 [6 marks]
(a) [2 marks]
Answer: Transcription occurs in the nucleus (of eukaryotic cells). [1 mark] The enzyme responsible is RNA polymerase. [1 mark]
(b) [2 marks]
Answer: tRNA (transfer RNA) molecules have an anticodon at one end (a sequence of three bases complementary to a codon on the mRNA) and a specific amino acid attached at the other end. [1 mark] During translation, tRNA molecules bring the correct amino acids to the ribosome in the order specified by the mRNA codons. The anticodon on the tRNA base-pairs with the complementary codon on the mRNA, ensuring that the correct amino acid is added to the growing polypeptide chain. [1 mark]
Teaching note: There are many different types of tRNA, each specific to one amino acid. The enzyme aminoacyl-tRNA synthetase attaches the correct amino acid to each tRNA molecule.
(c) [2 marks]
Answer: Proteins destined for secretion contain a signal sequence (a short sequence of amino acids at the N-terminus) that is recognised by a signal recognition particle (SRP). [1 mark] The SRP directs the ribosome to the rough endoplasmic reticulum, where the growing polypeptide chain is threaded into the ER lumen as it is synthesised. Inside the ER, the protein undergoes folding, modification (e.g., glycosylation), and is then transported in vesicles to the Golgi apparatus for further processing before being secreted. Free ribosomes in the cytoplasm synthesise proteins that function within the cytoplasm, nucleus, mitochondria, or other organelles. [1 mark]
Question 13 [4 marks]
(a) [3 marks]
Answer: An amino acid consists of a central alpha carbon atom bonded to four groups: an amino group (–NH₂), a carboxyl group (–COOH), a hydrogen atom (–H), and a variable R group (side chain) that determines the identity and properties of the amino acid. [1 mark]
Amino acids are joined together by condensation reactions (dehydration synthesis): the carboxyl group of one amino acid reacts with the amino group of another, releasing a water molecule (H₂O) and forming a peptide bond (–CO–NH–). [1 mark] This process is repeated to form a polypeptide chain, with the sequence of amino acids determined by the sequence of codons on the mRNA during translation. [1 mark]
(b) [1 mark]
Answer: Peptide bond. [1 mark]
Question 14 [4 marks]
(a) [2 marks]
Answer: Both curves reach the same Vmax because the competitive inhibitor binds reversibly to the active site of the enzyme. [1 mark] At very high substrate concentrations, the substrate molecules outcompete the inhibitor for binding to the active site, so all enzyme molecules can eventually be occupied by substrate, and the reaction proceeds at the same maximum rate as without the inhibitor. [1 mark]
Teaching note: This is the defining characteristic of competitive inhibition — Vmax is unchanged because the inhibition can be overcome by increasing substrate concentration.
(b) [2 marks]
Answer: In the presence of a competitive inhibitor, some enzyme molecules have the inhibitor bound to their active site instead of the substrate. [1 mark] Therefore, a higher substrate concentration is needed to ensure that enough enzyme molecules have substrate (rather than inhibitor) bound to achieve the maximum rate of reaction. The apparent Km is increased because the enzyme's apparent affinity for the substrate is reduced — more substrate is required to reach half of Vmax. [1 mark]
Teaching note: Km (Michaelis constant) is the substrate concentration at which the reaction rate is half of Vmax. A higher Km indicates lower apparent affinity of the enzyme for the substrate. Competitive inhibitors increase Km but do not affect Vmax.
End of Answer Key
Summary of Marks
| Section | Marks |
|---|---|
| Section A (Questions 1–8) | 30 |
| Section B (Questions 9–14) | 30 |
| Total | 60 |
Free quiz and exam paper access
Enter your details to view this paper
Your access is remembered on this device.